Smart Construction Dashboard User Manual English version

Getting started
Users can access the Viewer with a Smart Construction account. Users belong to a company, where they share and view jobsite data. The admin account can add and remove users from a company.
Setting up a new company
Choose an email to serve as the admin account for a company. The email address you provide will receive an activation link to create a Smart Construction account to view the portal. Follow the instructions to create the account.
Smart Construction portal

In the Smart Construction portal, you can:
- Manage your account profile, including your email address and language
- Change your password
- Change notification and security settings for your account
- Invite new users if you have an admin account
Adding new users to your company
Adding a user to your company will allow them to see all projects.
To add a new user to a company, you must have an admin account.
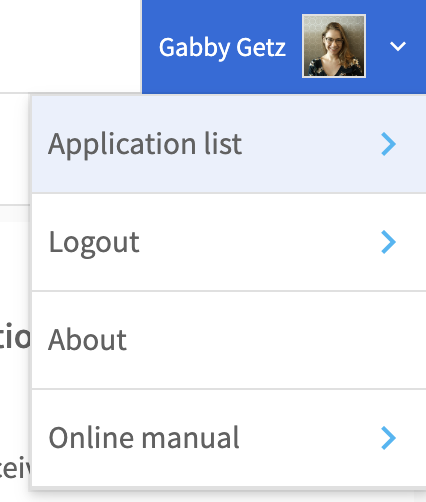
Click the username in the top right corner and select Application list
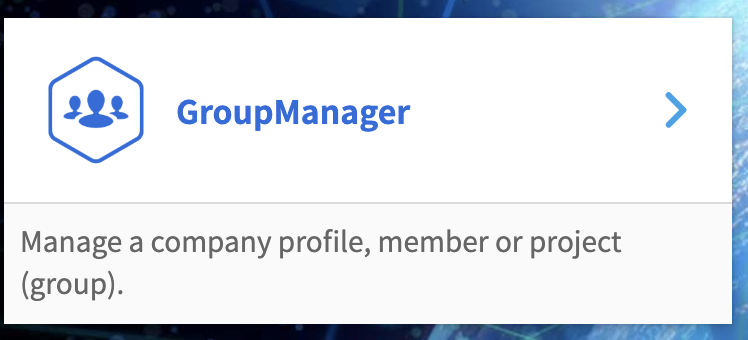
In the applications list, select Group Setting
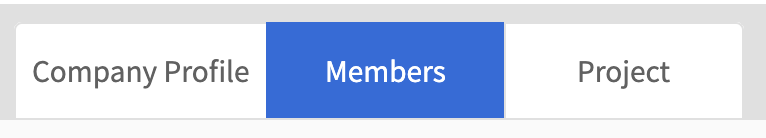
In the left navigation, select Members
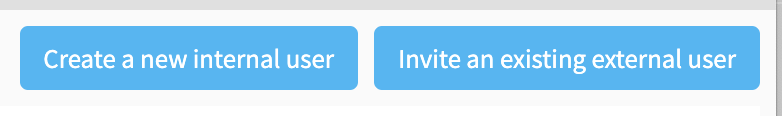
Select Create a new internal user or Invite an existing external user.
Access Smart Construction Dashboard
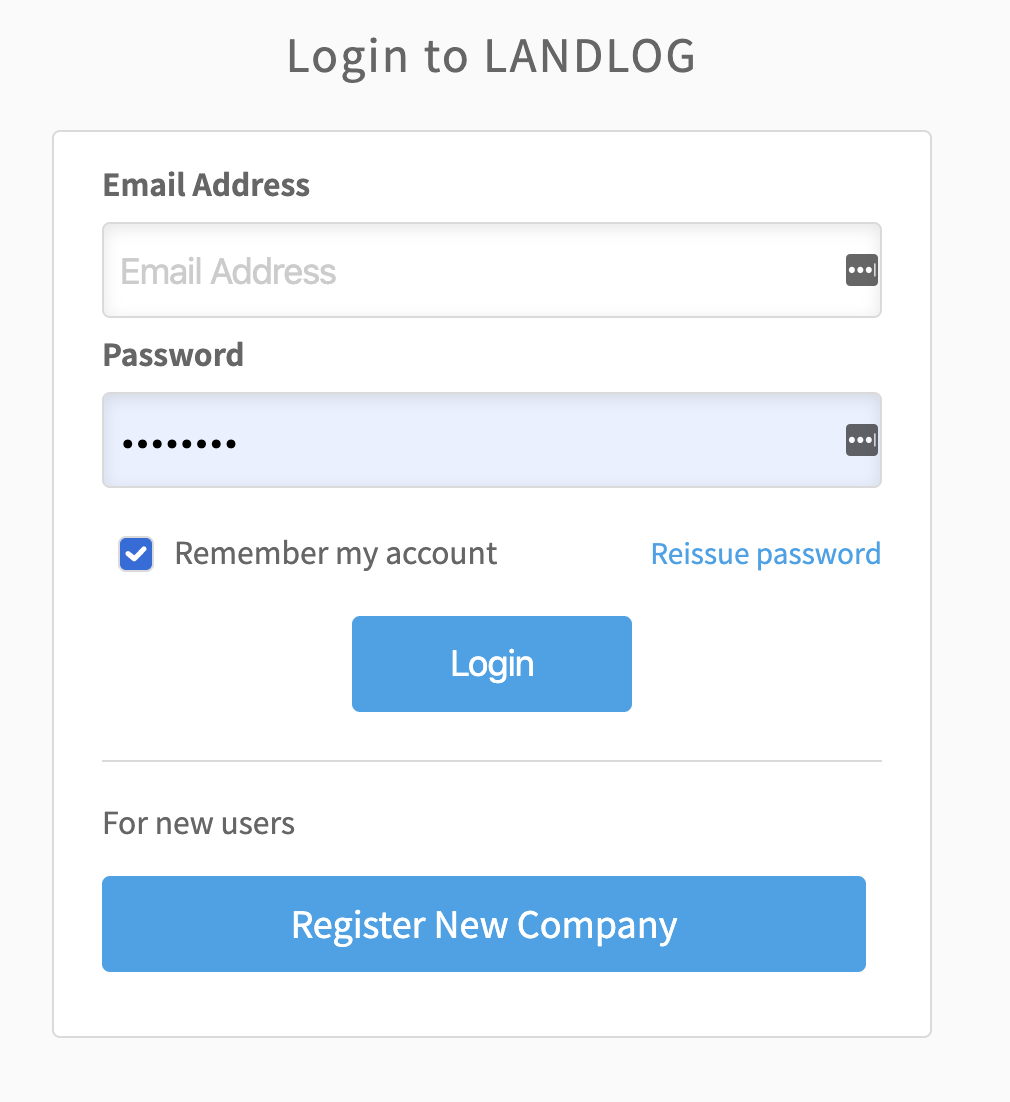
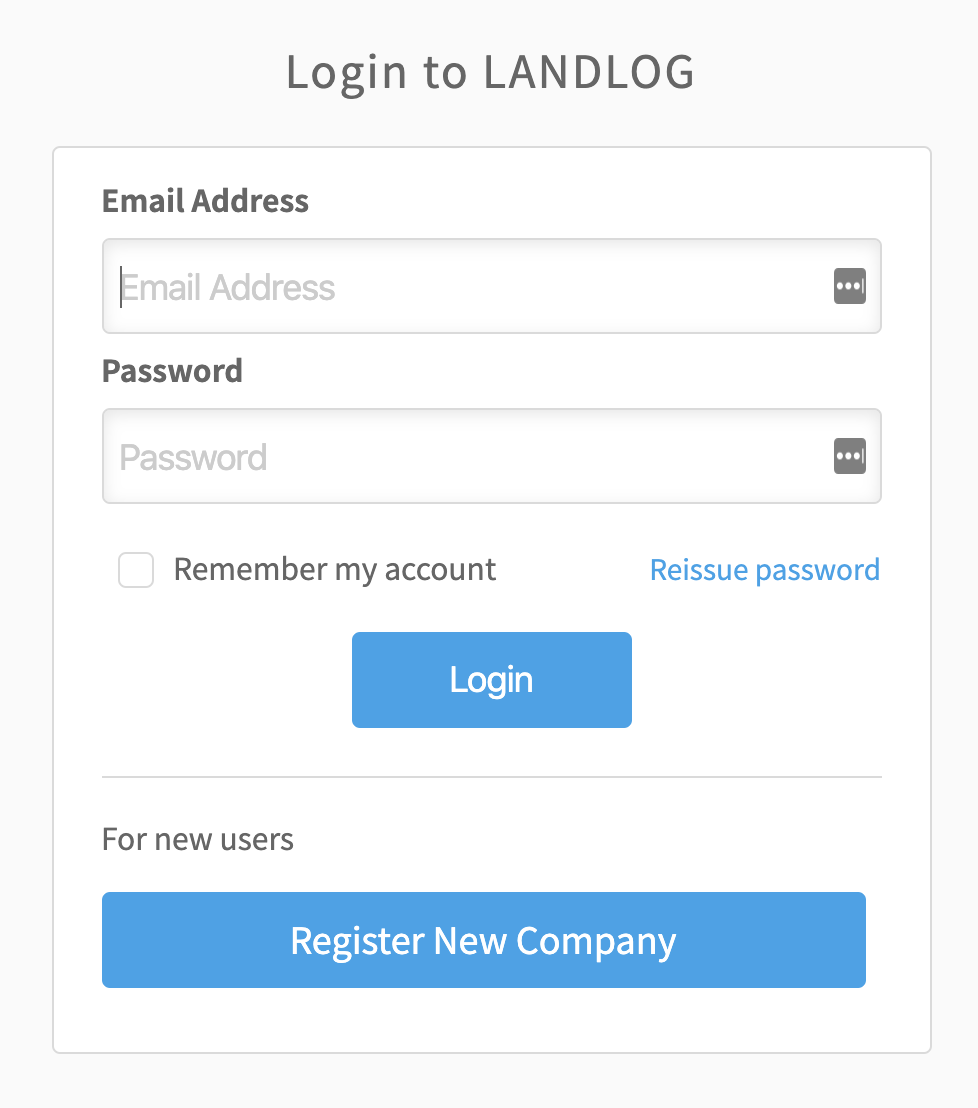
When your account has been created, you can now access Smart Construction Dashboard.In your browser, navigate to https://dashboard.smartconstruction.com/
Click Sign in with Smart Construction and enter your login information. You will be redirected to the Login to Smart Construction page to enter your credentials.
Access Smart Construction portal from Smart Construction Dashboard
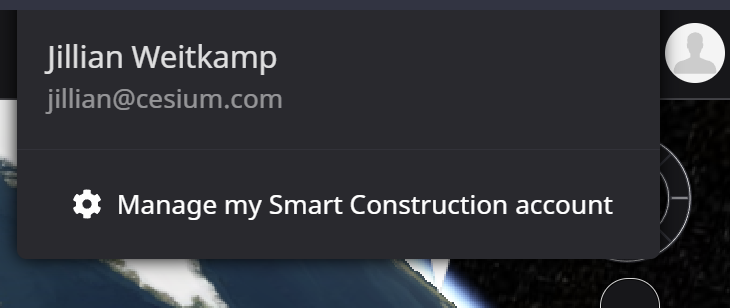
At any time, you can access your Smart Construction portal from Smart Construction Dashboard application. Click your user icon in the top right of the viewer to open the account menu, then click Manage my Smart Construction account to open the Smart Construction portal.
User Support menu
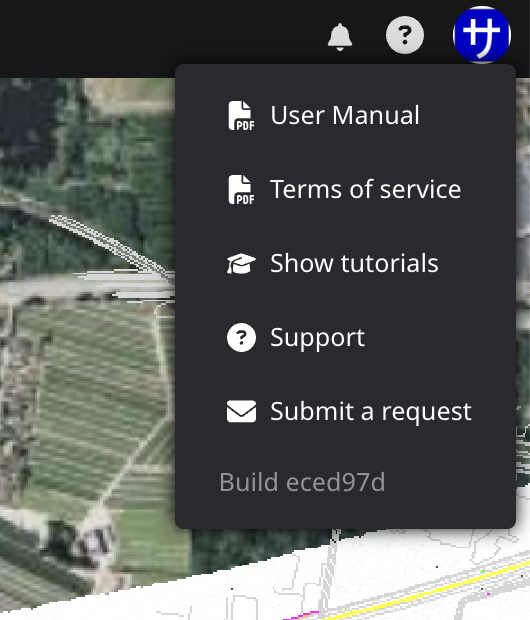
The User Support Menu can be opened from the top right corner of the Dashboard screen by clicking on the "? icon in the upper right corner of the Dashboard screen. This menu contains the following items.
- User Manual
- Terms of Service
- Show tutorials
- Support
- Submit a request
- Version Number
User Manual
- You can browse Dashboard's online manual here.
Terms of Service
- Open latest Terms of Service of Dashboard.
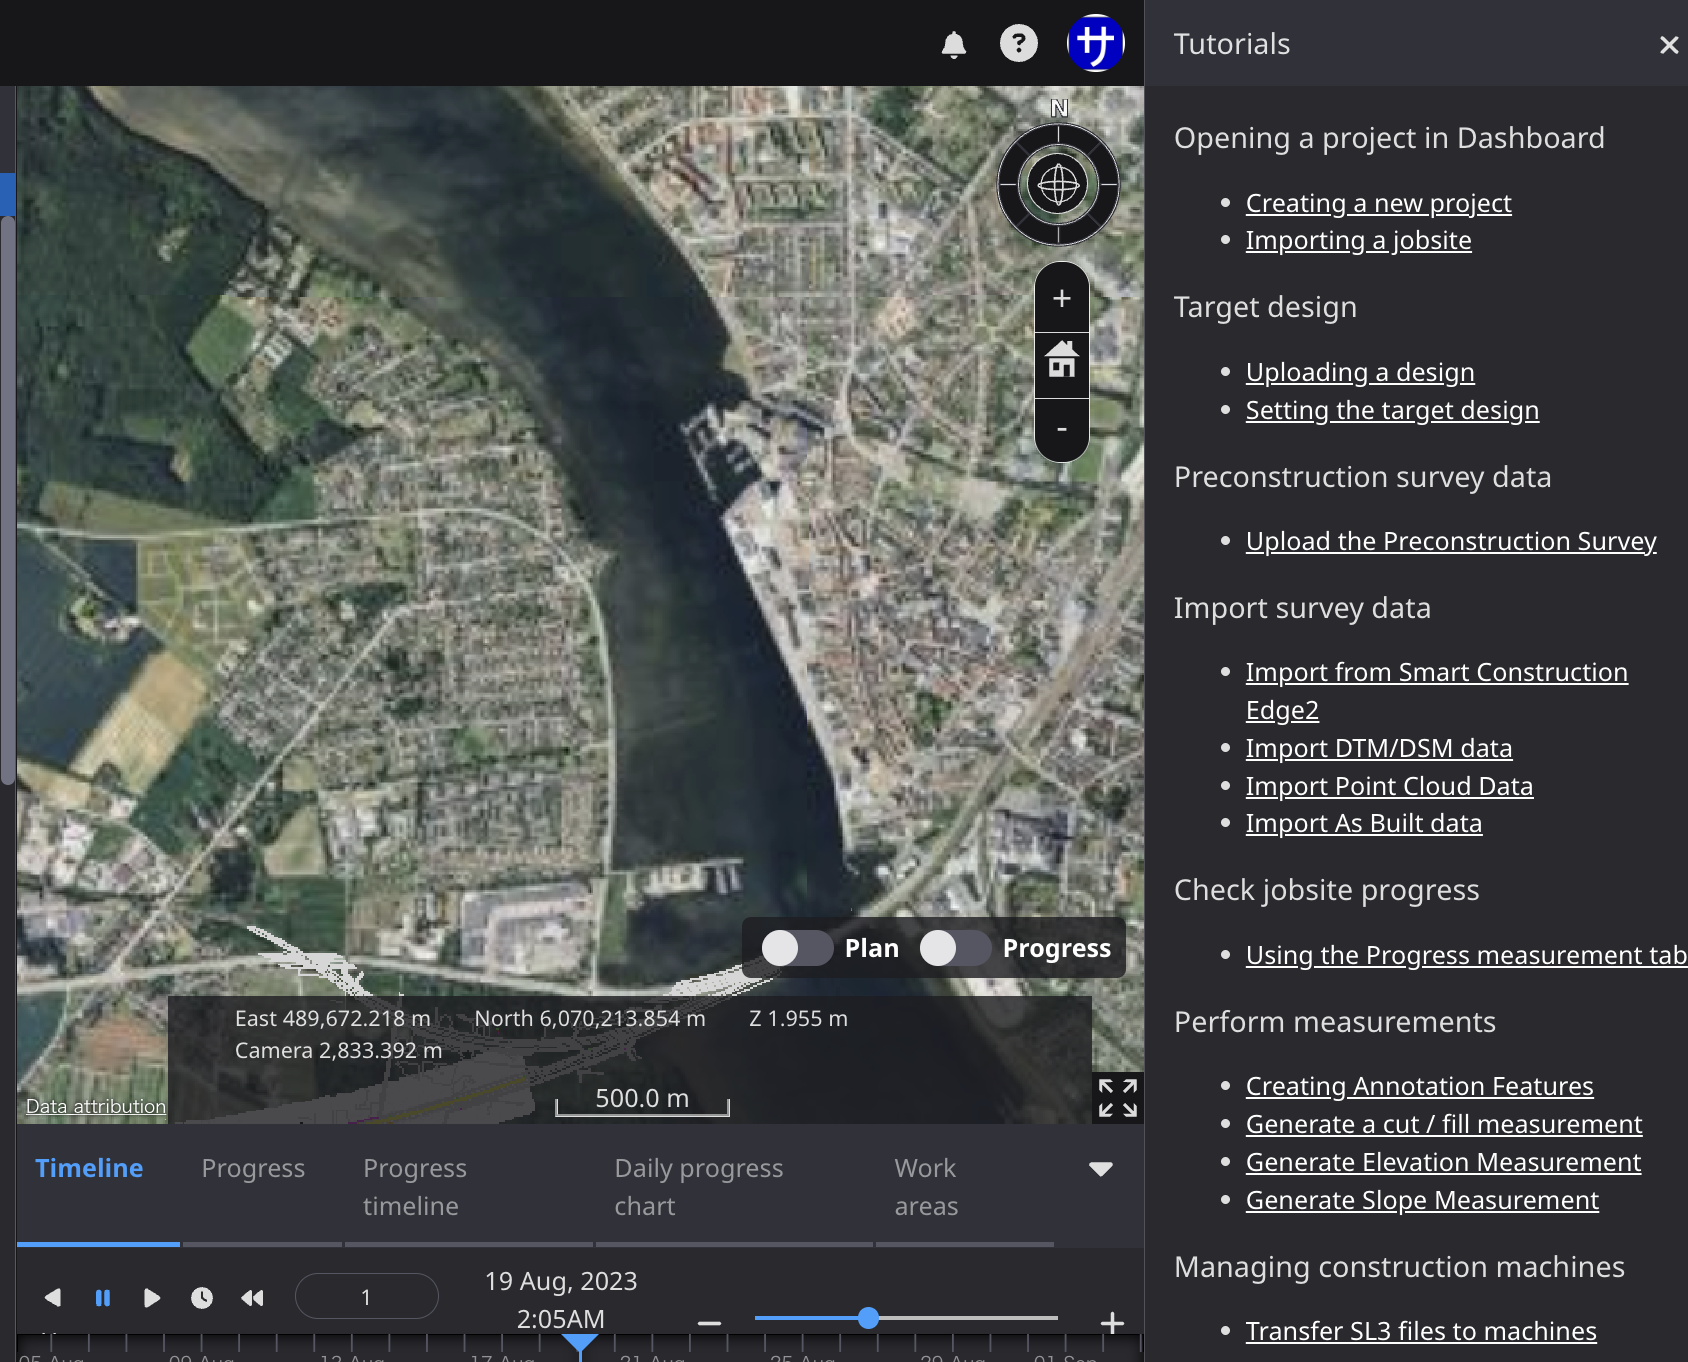
Show tutorials
- Open the Dashboard Tutorial. This tutorial provides step-by-step instructions on how to use each feature.
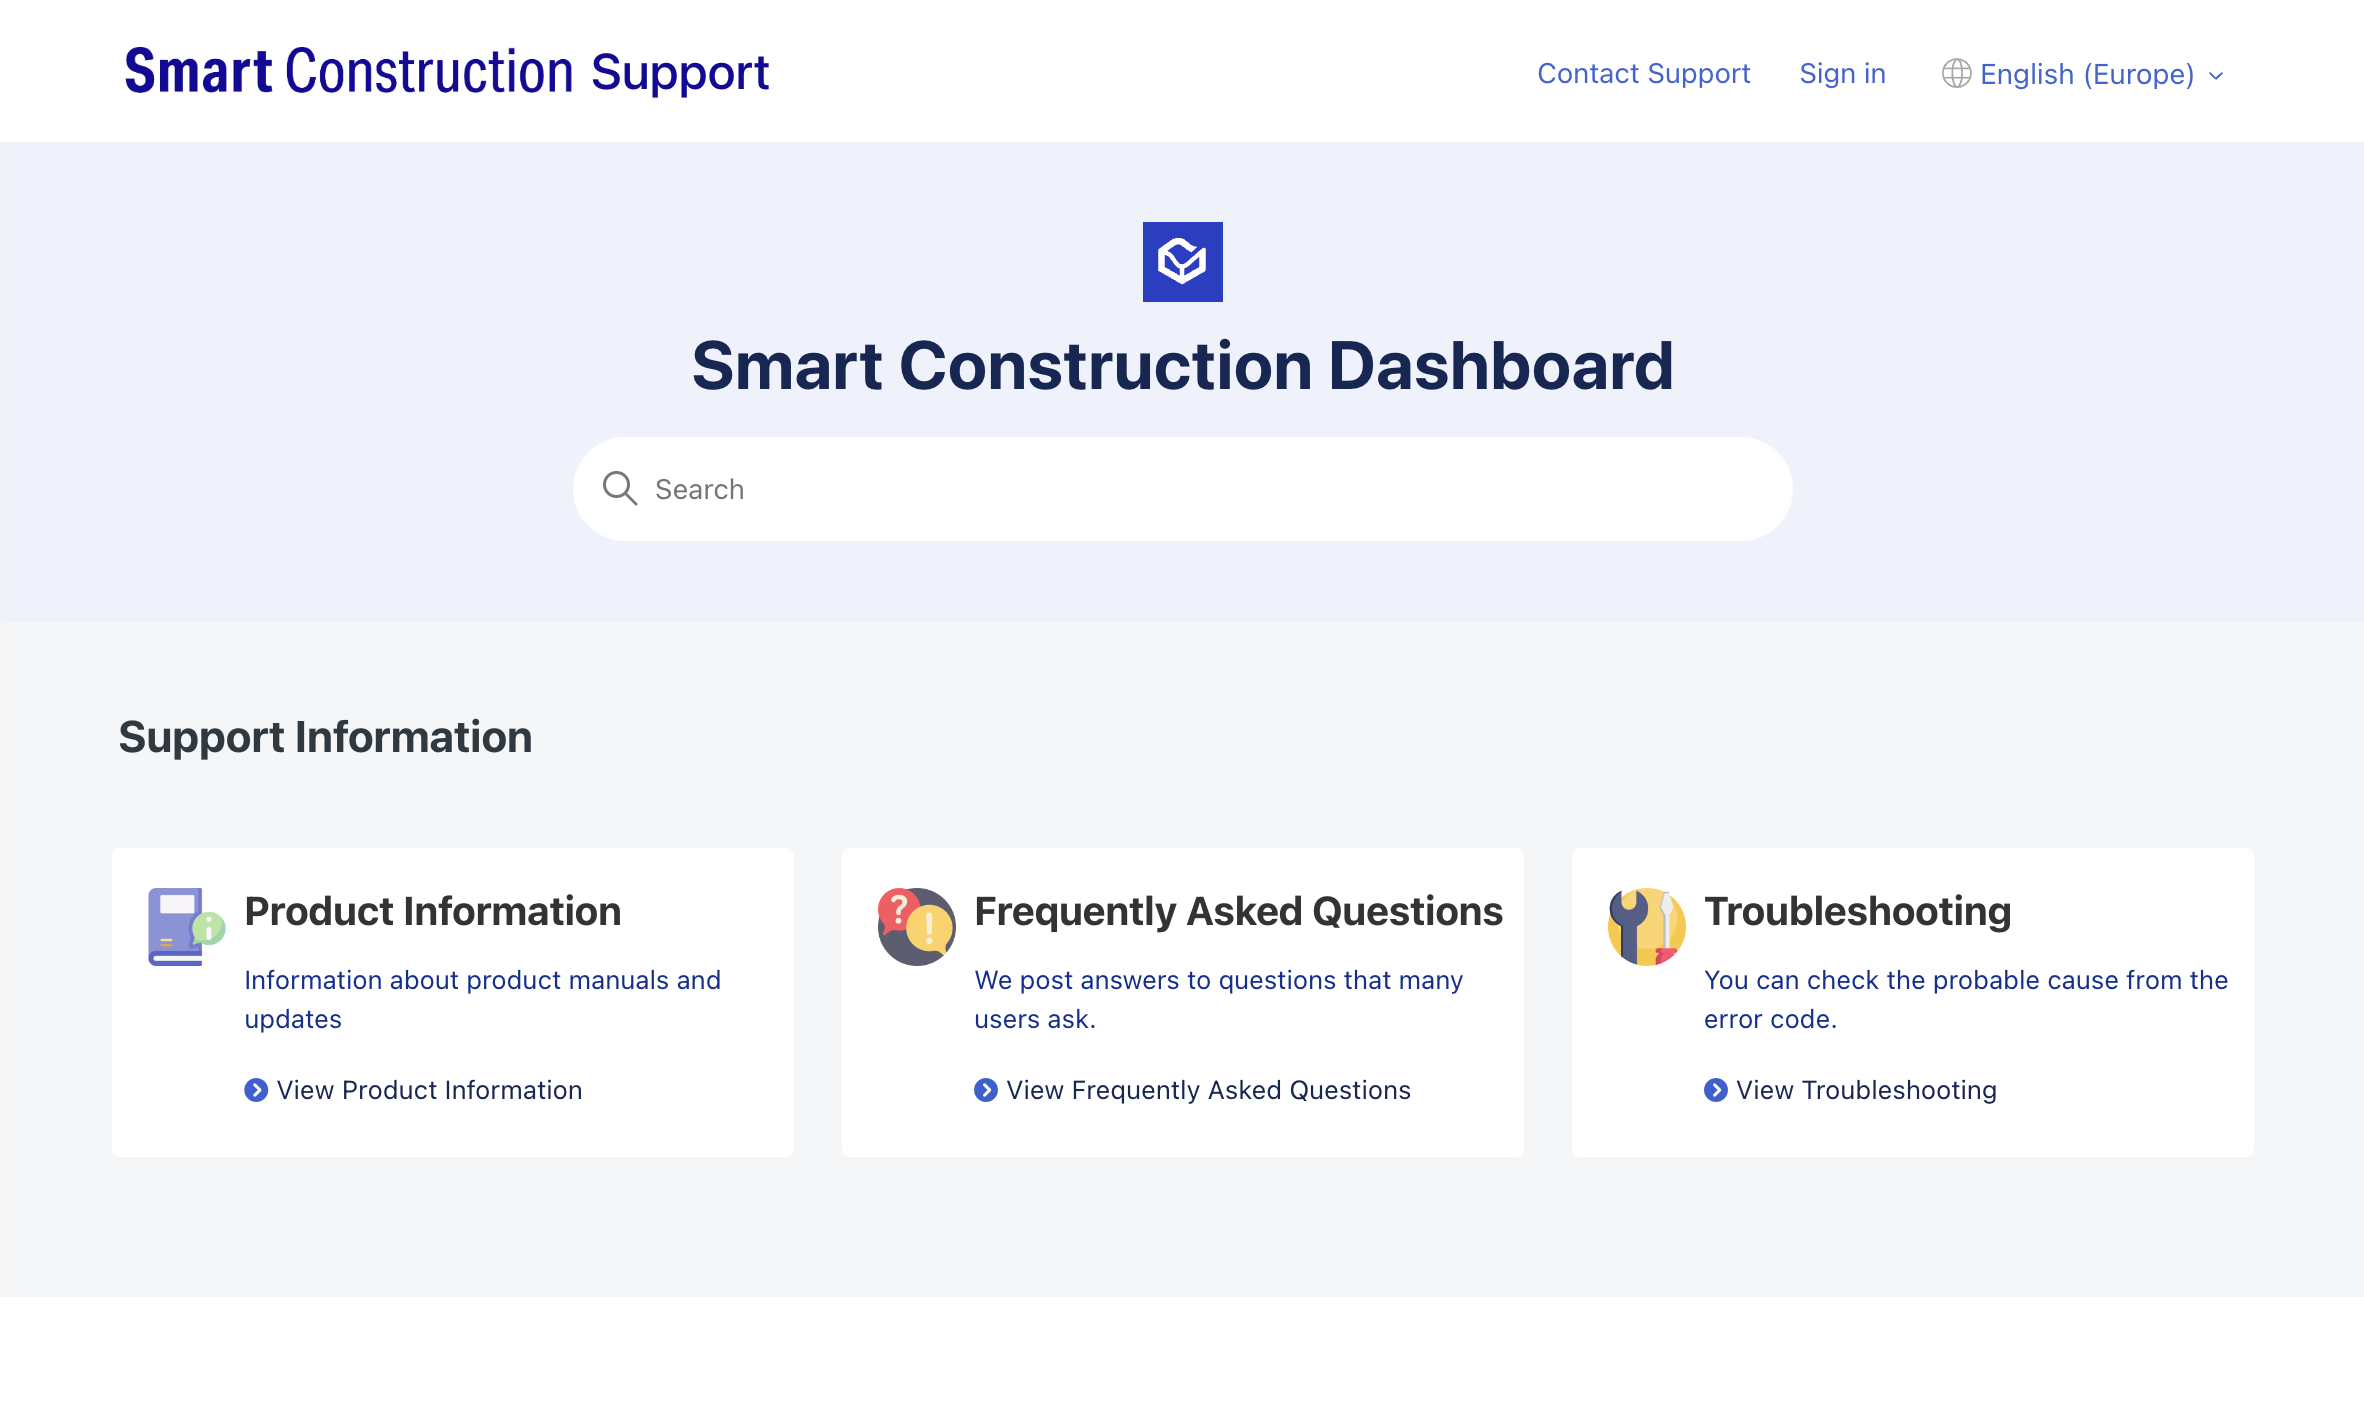
Support
- Open the Dashboard customer support web site. This site provides release notes, FAQs, and information about Troble Shooting.
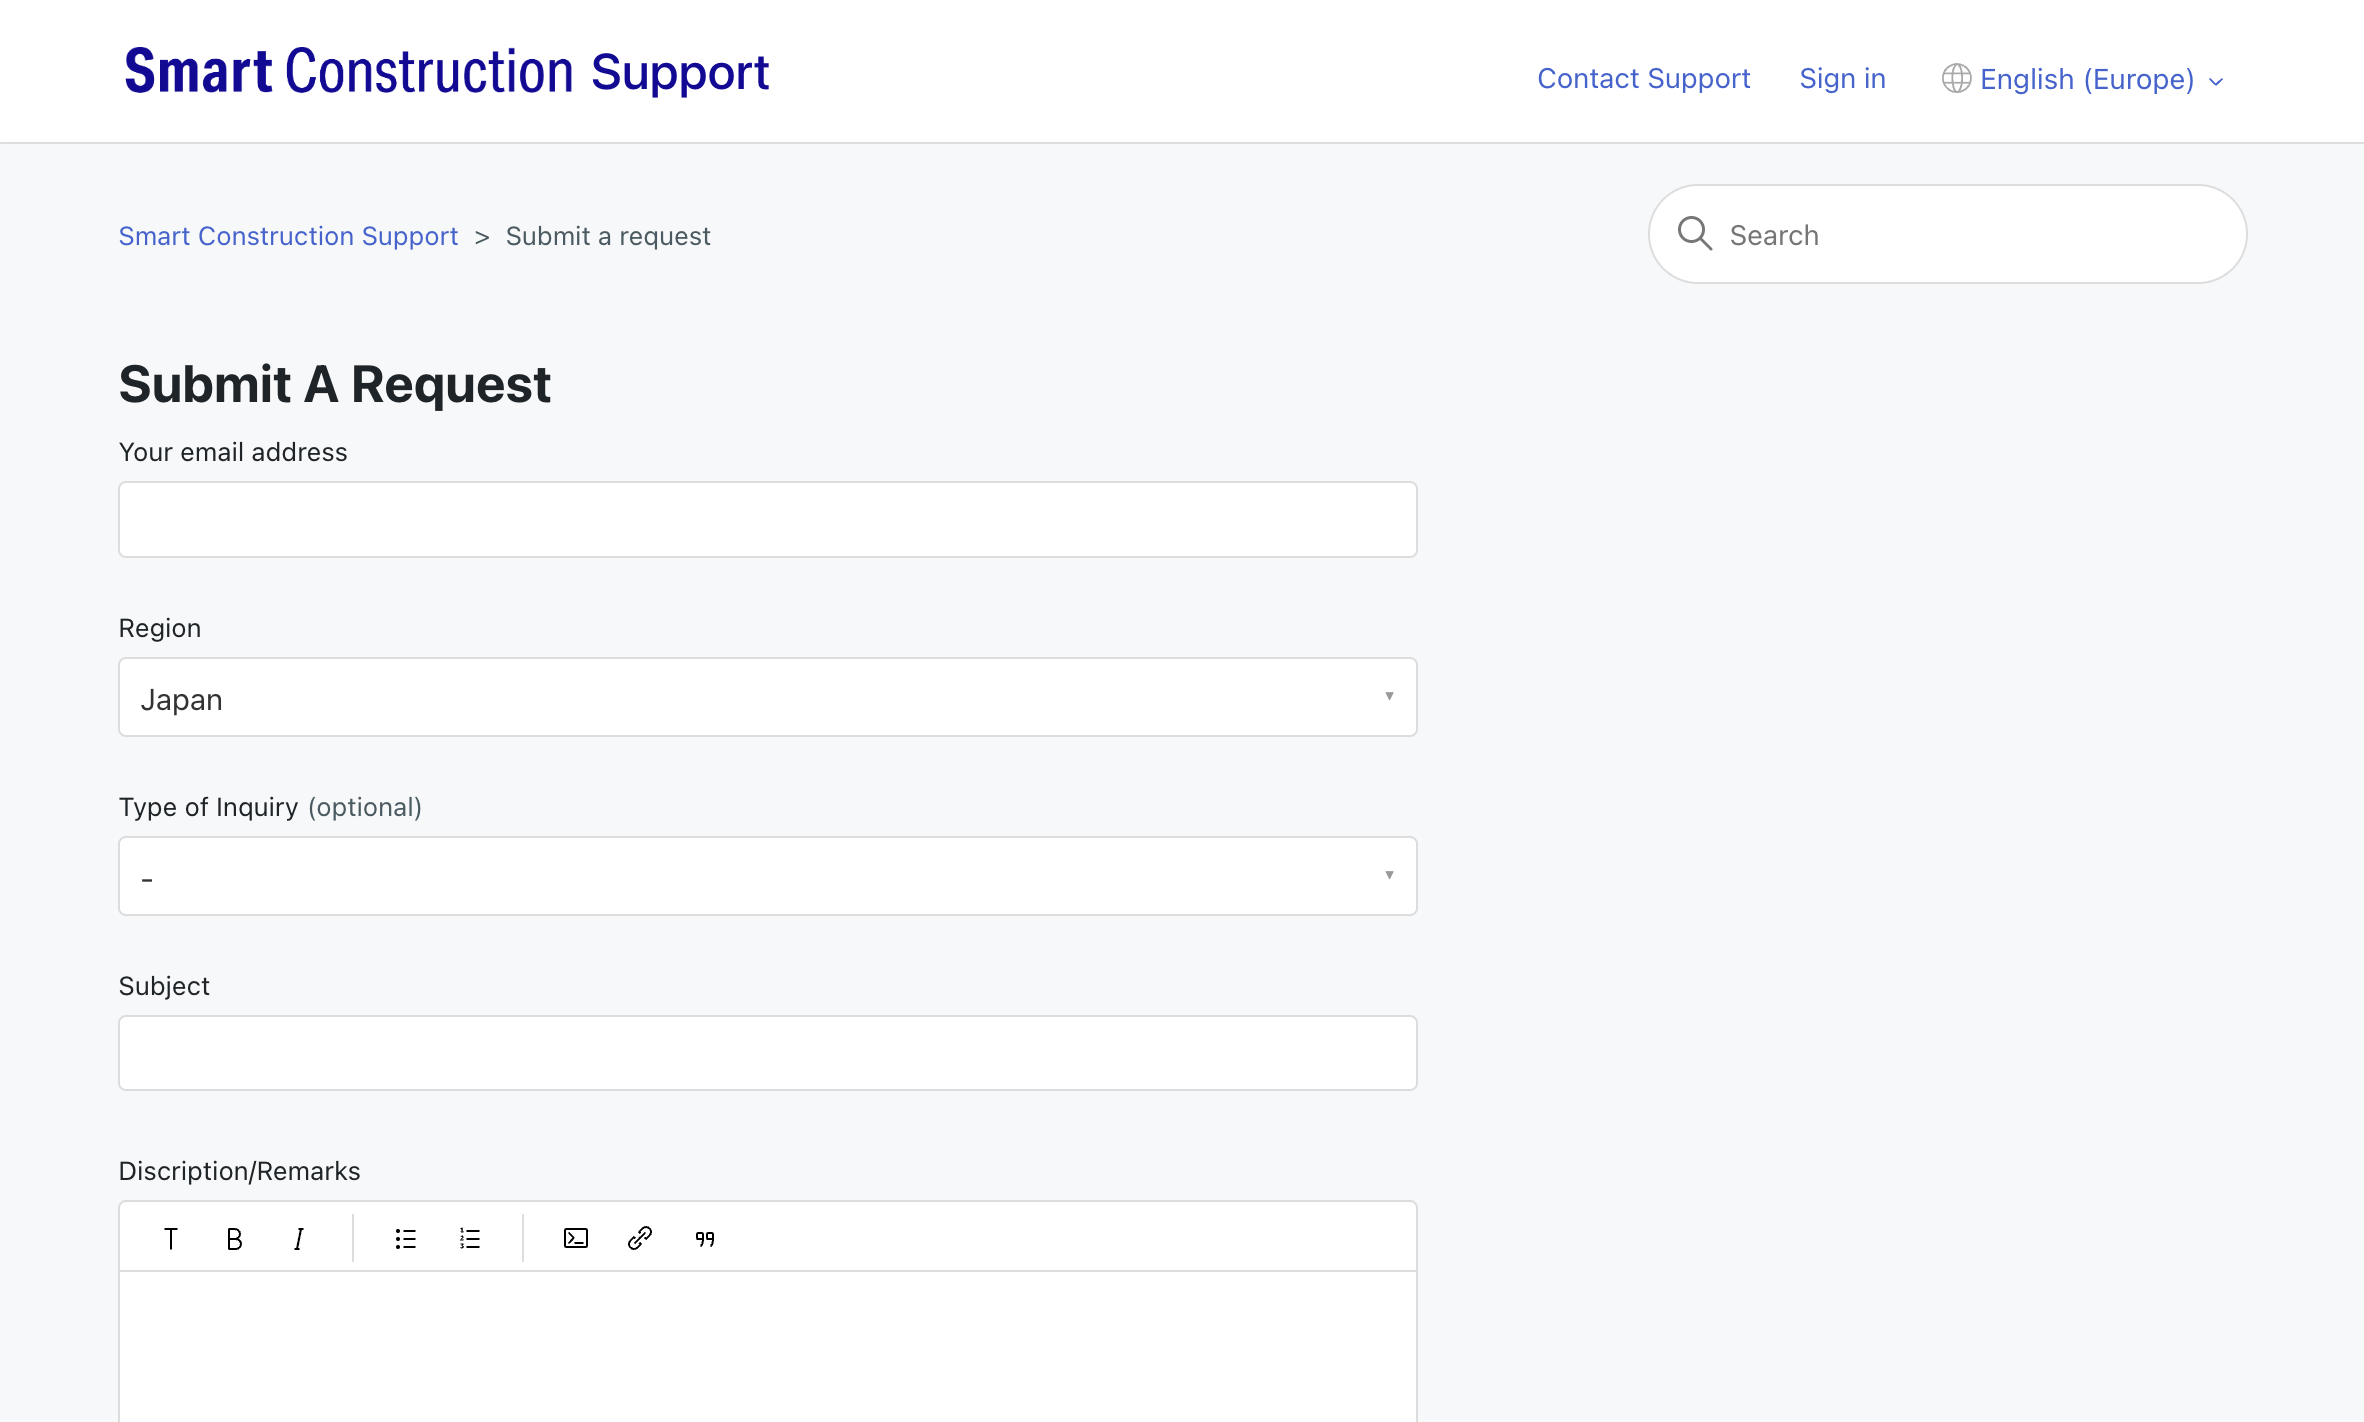
Submit a request
- Contact the Smart Construction Support Center via the web.
Version Number
- The version number of the Dashboard is displayed in the format “Build xxxxx”. Since the Dashboard always opens with the latest version, you usually do not need to be aware of this information, but if you have a problem, it will help us to isolate the problem if you notify us with this information.
Projects
Projects created by a user can be seen by other members of the same company.
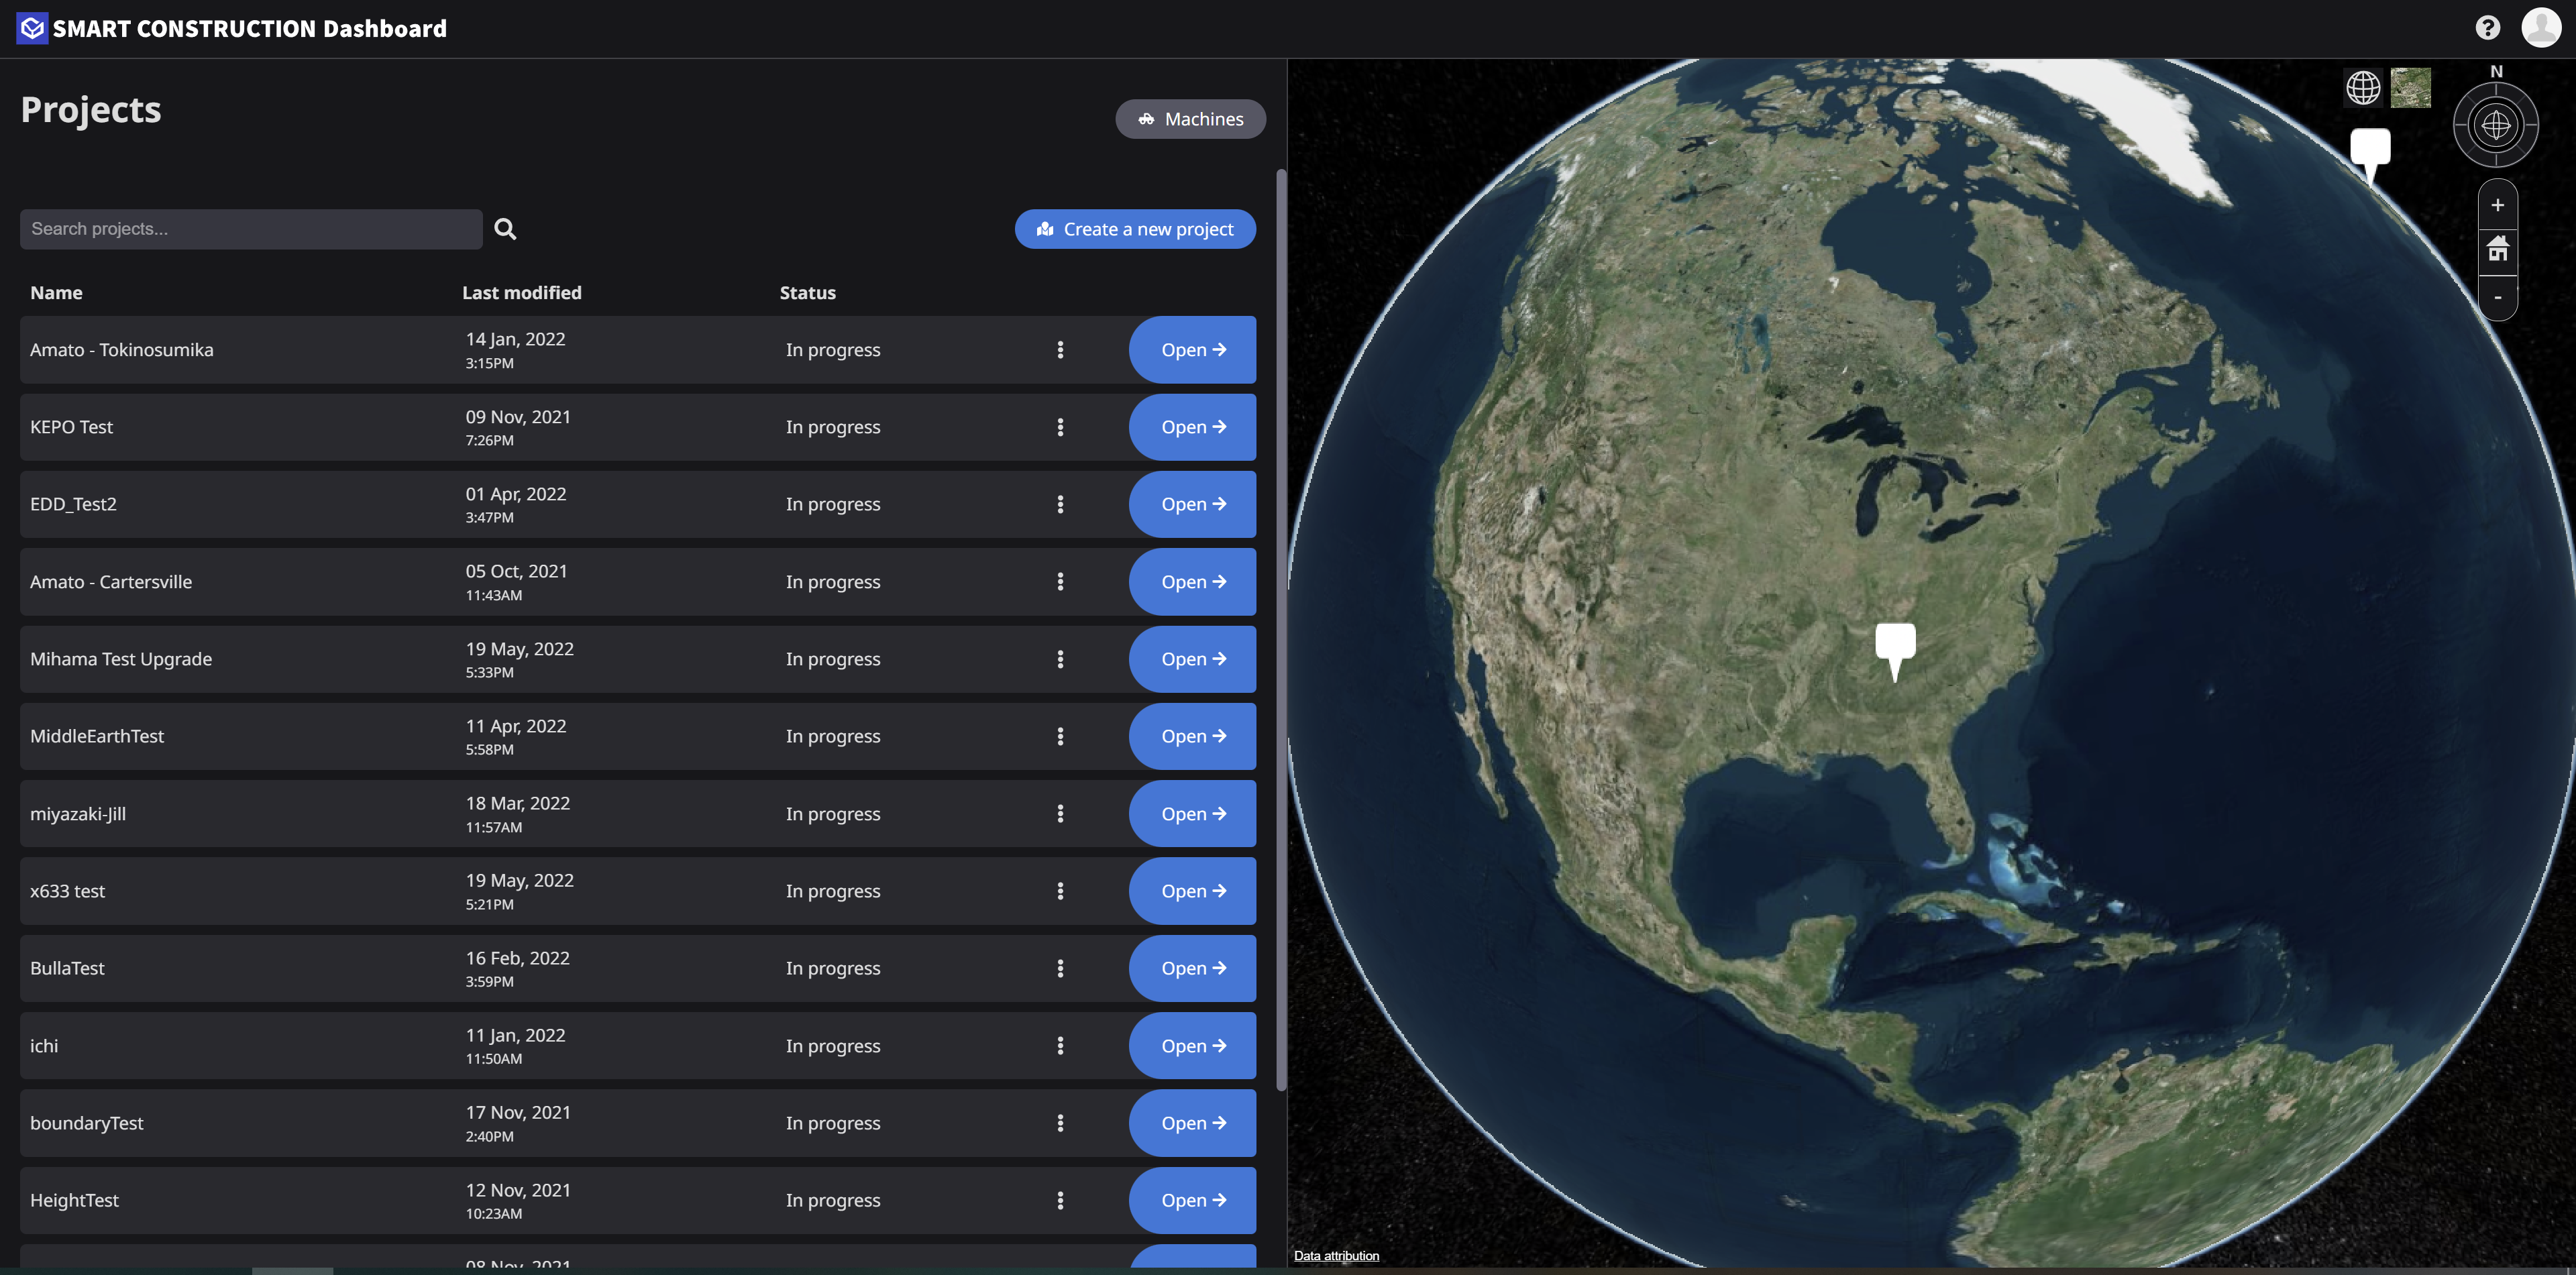
Project list page
After signing in, the default page is the project list page. This displays all of the projects, or job sites, which your company has created and you are a member. From this page you can:
Open a Project
Open a project
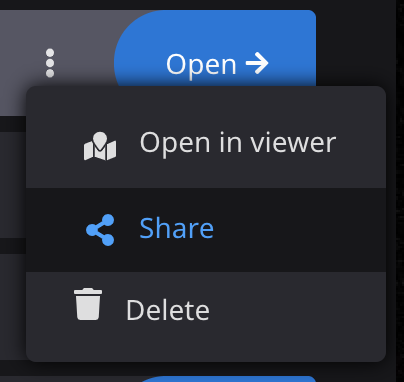
To open a project in Smart Construction Dashboard, click the blue Open right arrow icon.

Share a project
To get the link to share a project, open the context menu and select Share. The link will be copied to your clipboard.
Only other members of your company will be able to access links to projects.
Search projects by name
You can filter the list of projects by typing a project name in the Search projects textbox.

Sort project list
Sort the list of projects by jobsite name, by the date the project was last modified, or by jobsite status by clicking one of the column headers. Projects can be sorted in ascending or descending order.

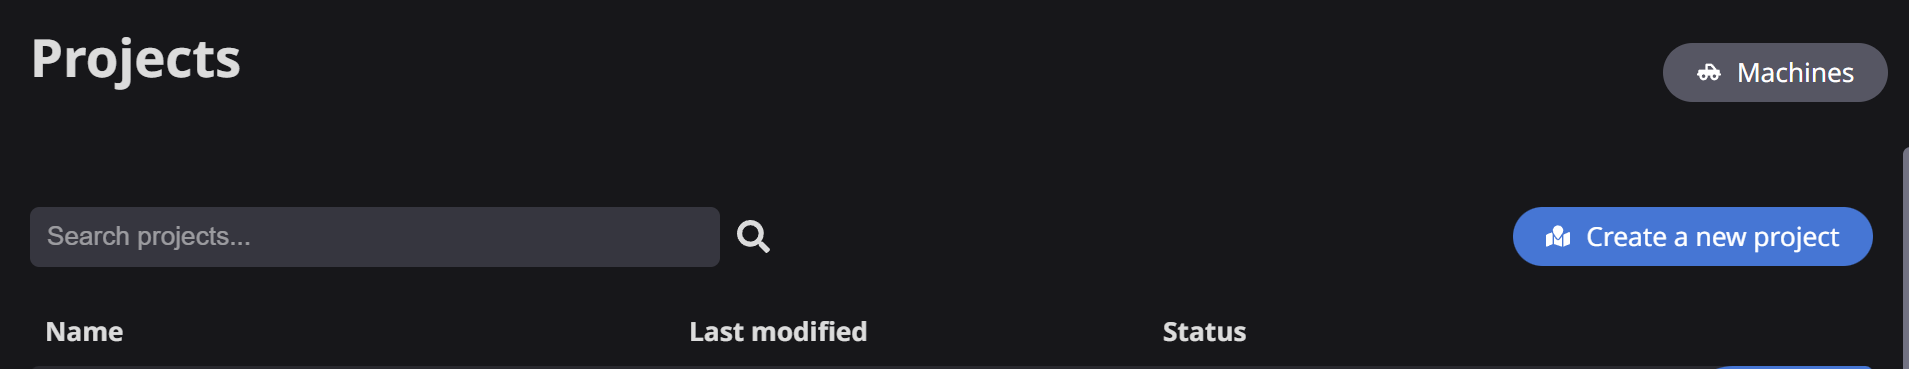
Create a new project for a jobsite
To create a new project from user data, click the Create a new project button.
You will be prompted to select a jobsite. If none are available, you will be prompted to create one in Smart Construction using the Jobsite Setting.
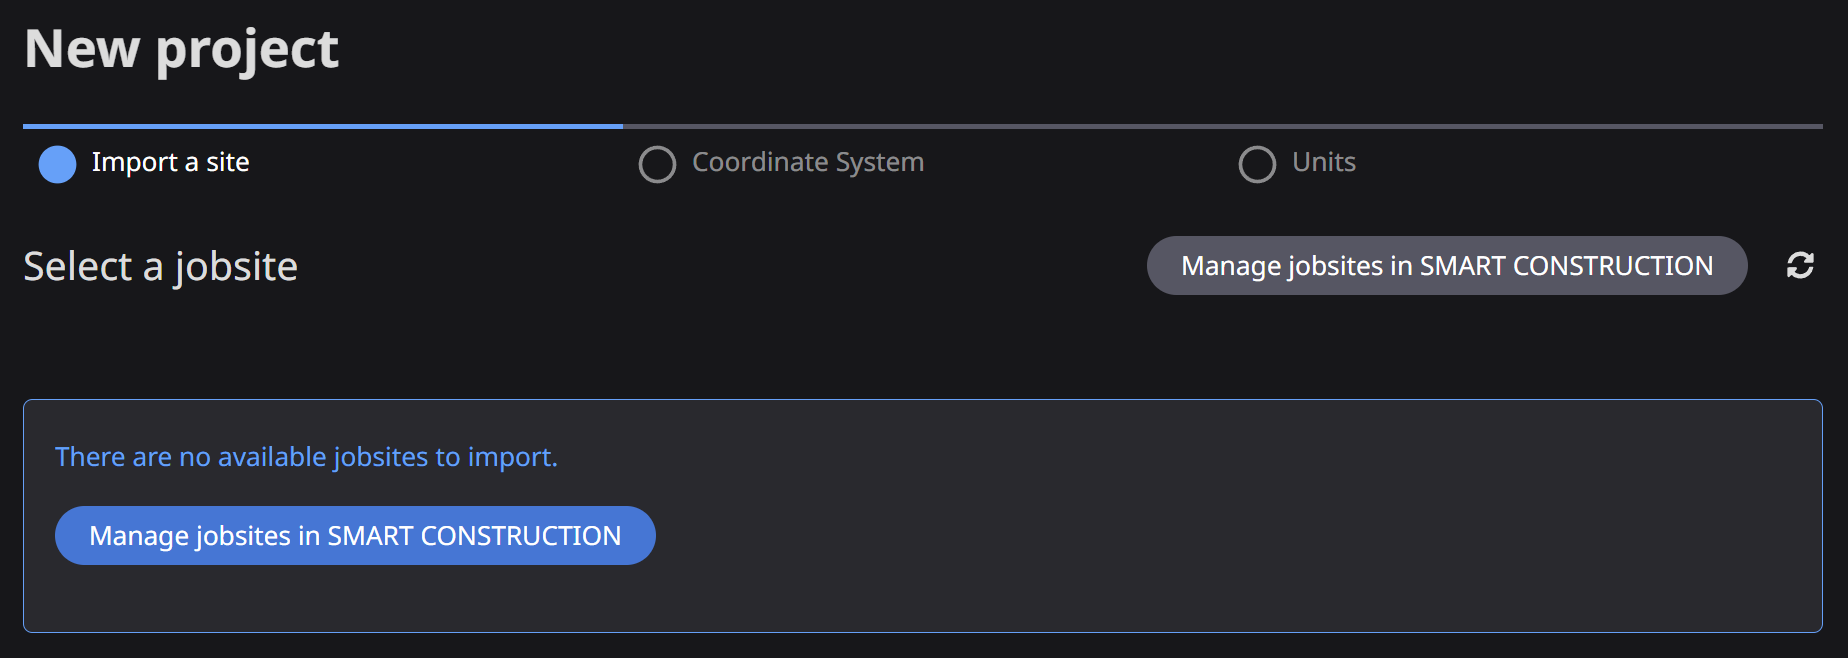
Once you have launched the Jobsite Setting, click the New Registration button.

Enter jobsite details, including name, address information, location, units, and construction start and end dates.
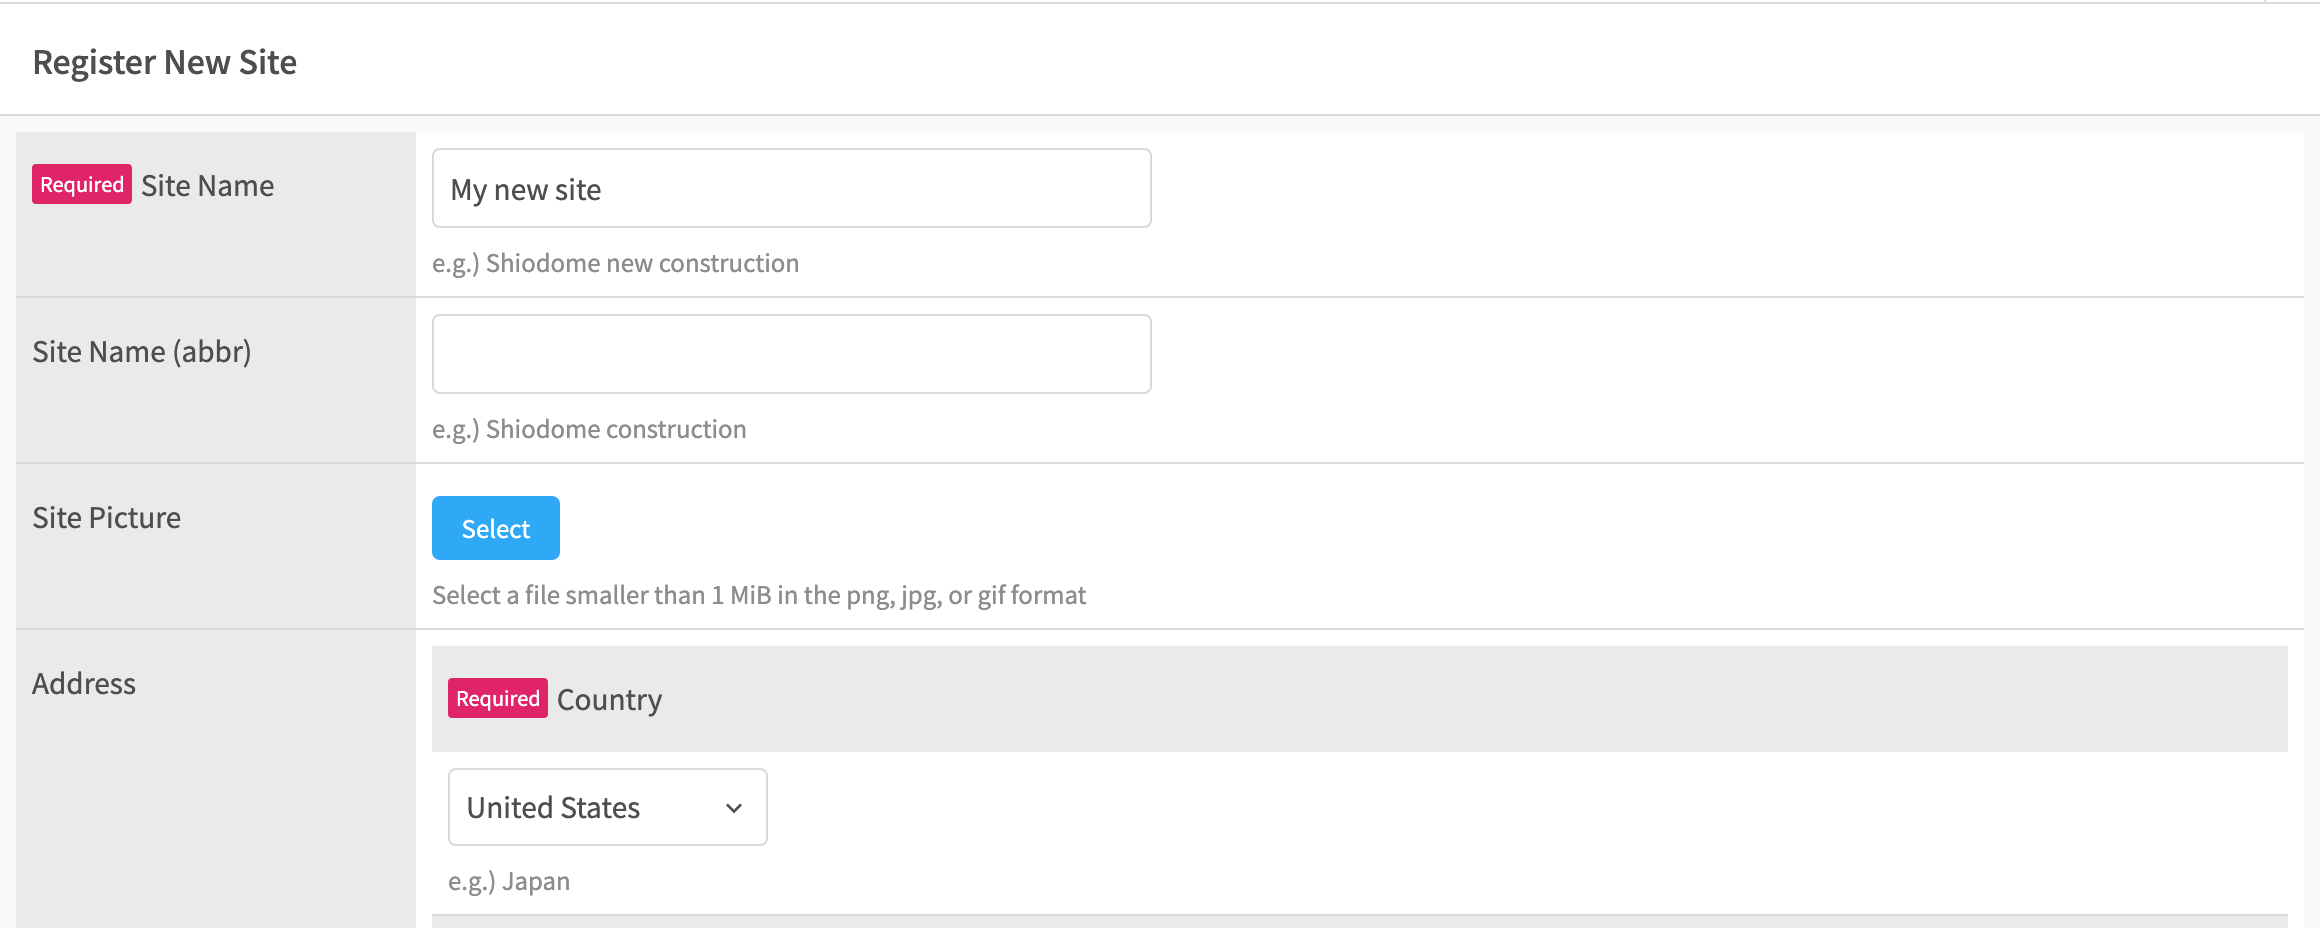
Once you have confirmed your site details, click Register to create the jobsite. Back in the SC Dashboard portal, select the jobsite to import from the list, then click Next.

Set jobsite coordinate system
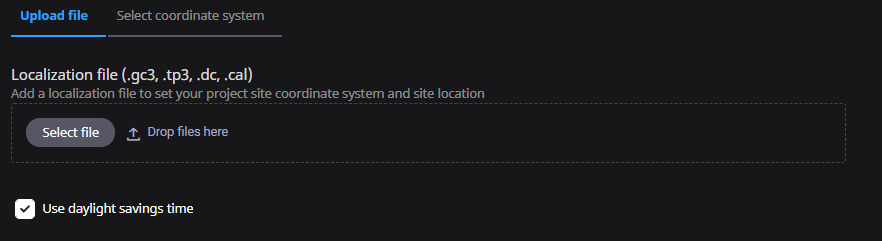
A coordinate system must be defined for each jobsite. You can set the jobsite coordinate system by
- Upload a localization file with control point information. Supported formats are Topcon (.gc3, .tc3) and Trimble (.cal, .dc).
- Manually select a coordinate system specific for the jobsite
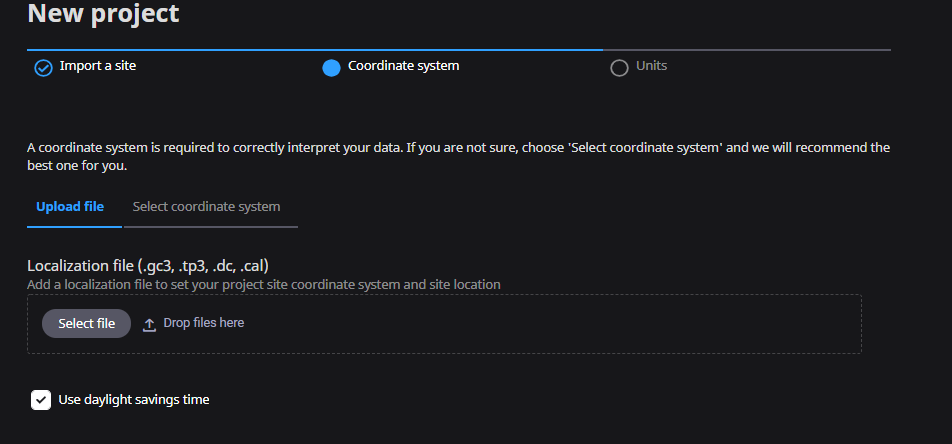
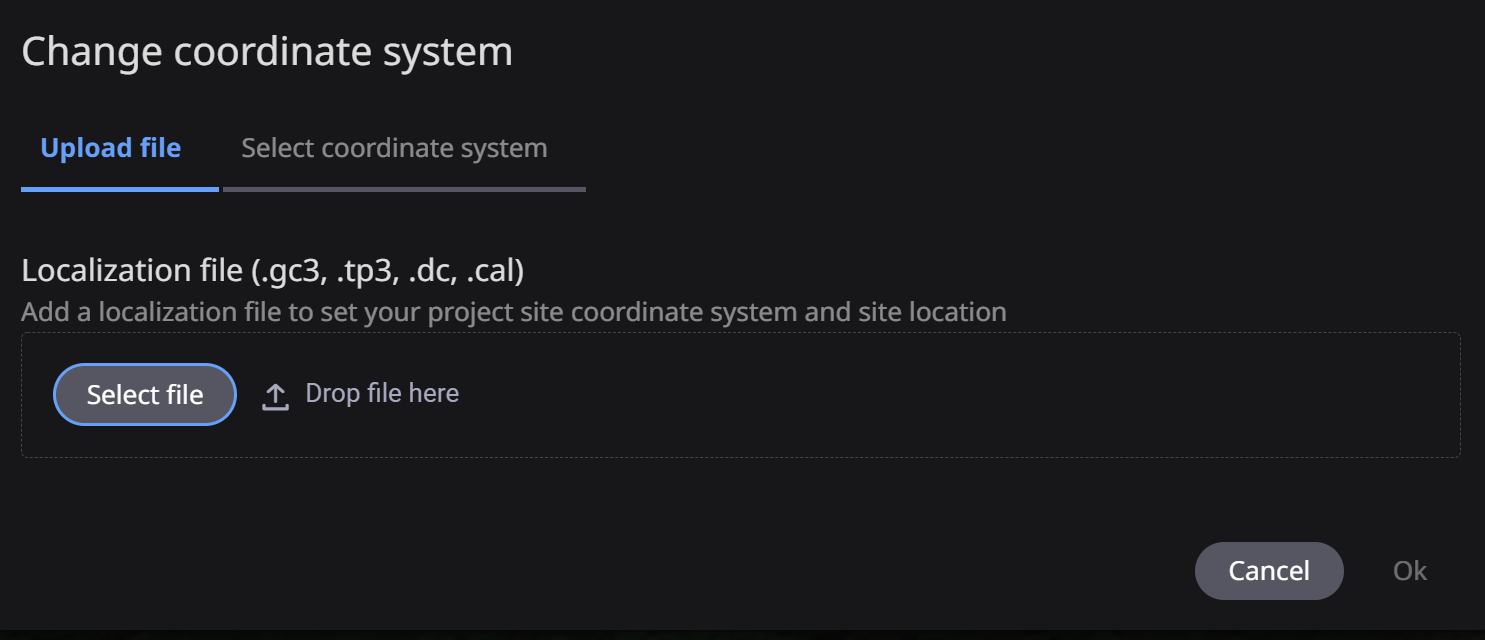
Upload file Click Select file or drag and drop a supported localization file. This will set your project site coordinate system, exact site location, and suggested time zone.
For more information about viewing control points, see Control points.
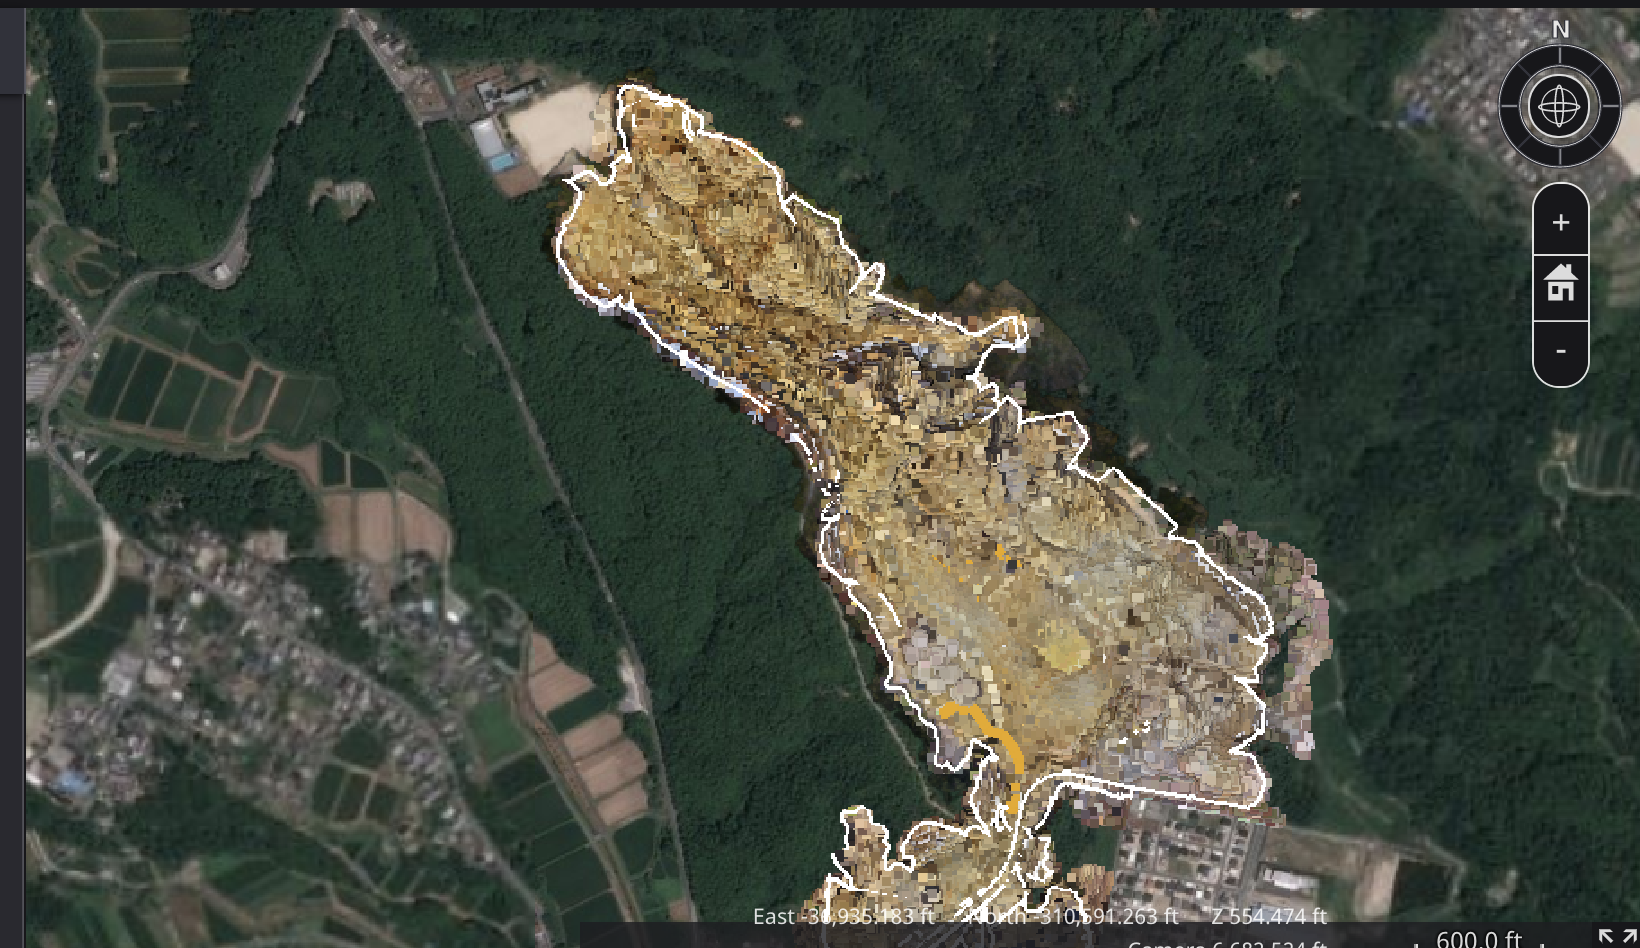
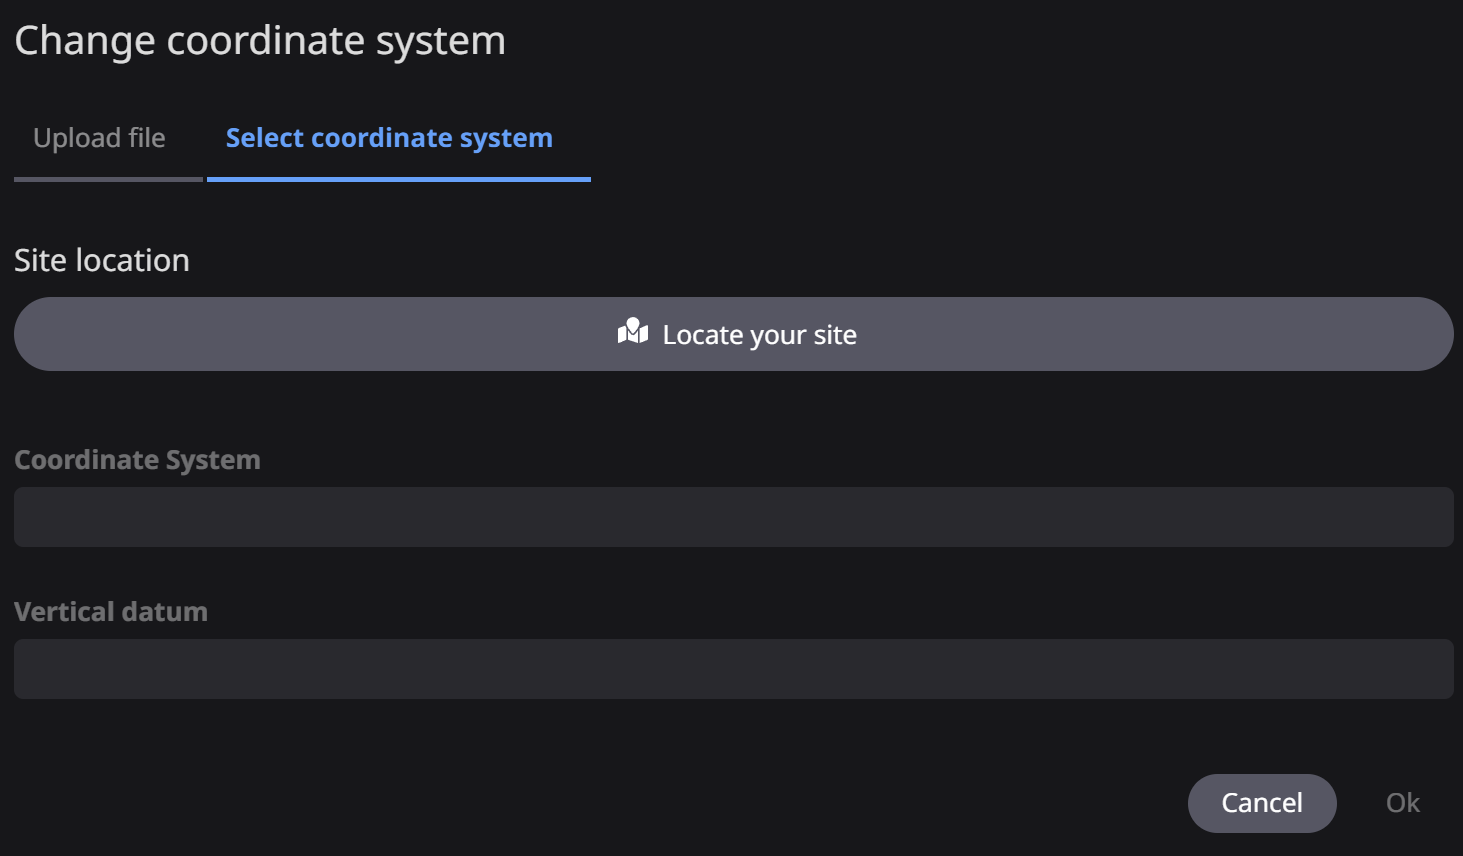
Select coordinate system Start by Clicking Locate your site to define the location of the jobsite.
In the map display navigate to your jobsite location.
Click the location in the map. Then select Confirm location.
Select the appropriate coordinate system and vertical datum for your jobsite.
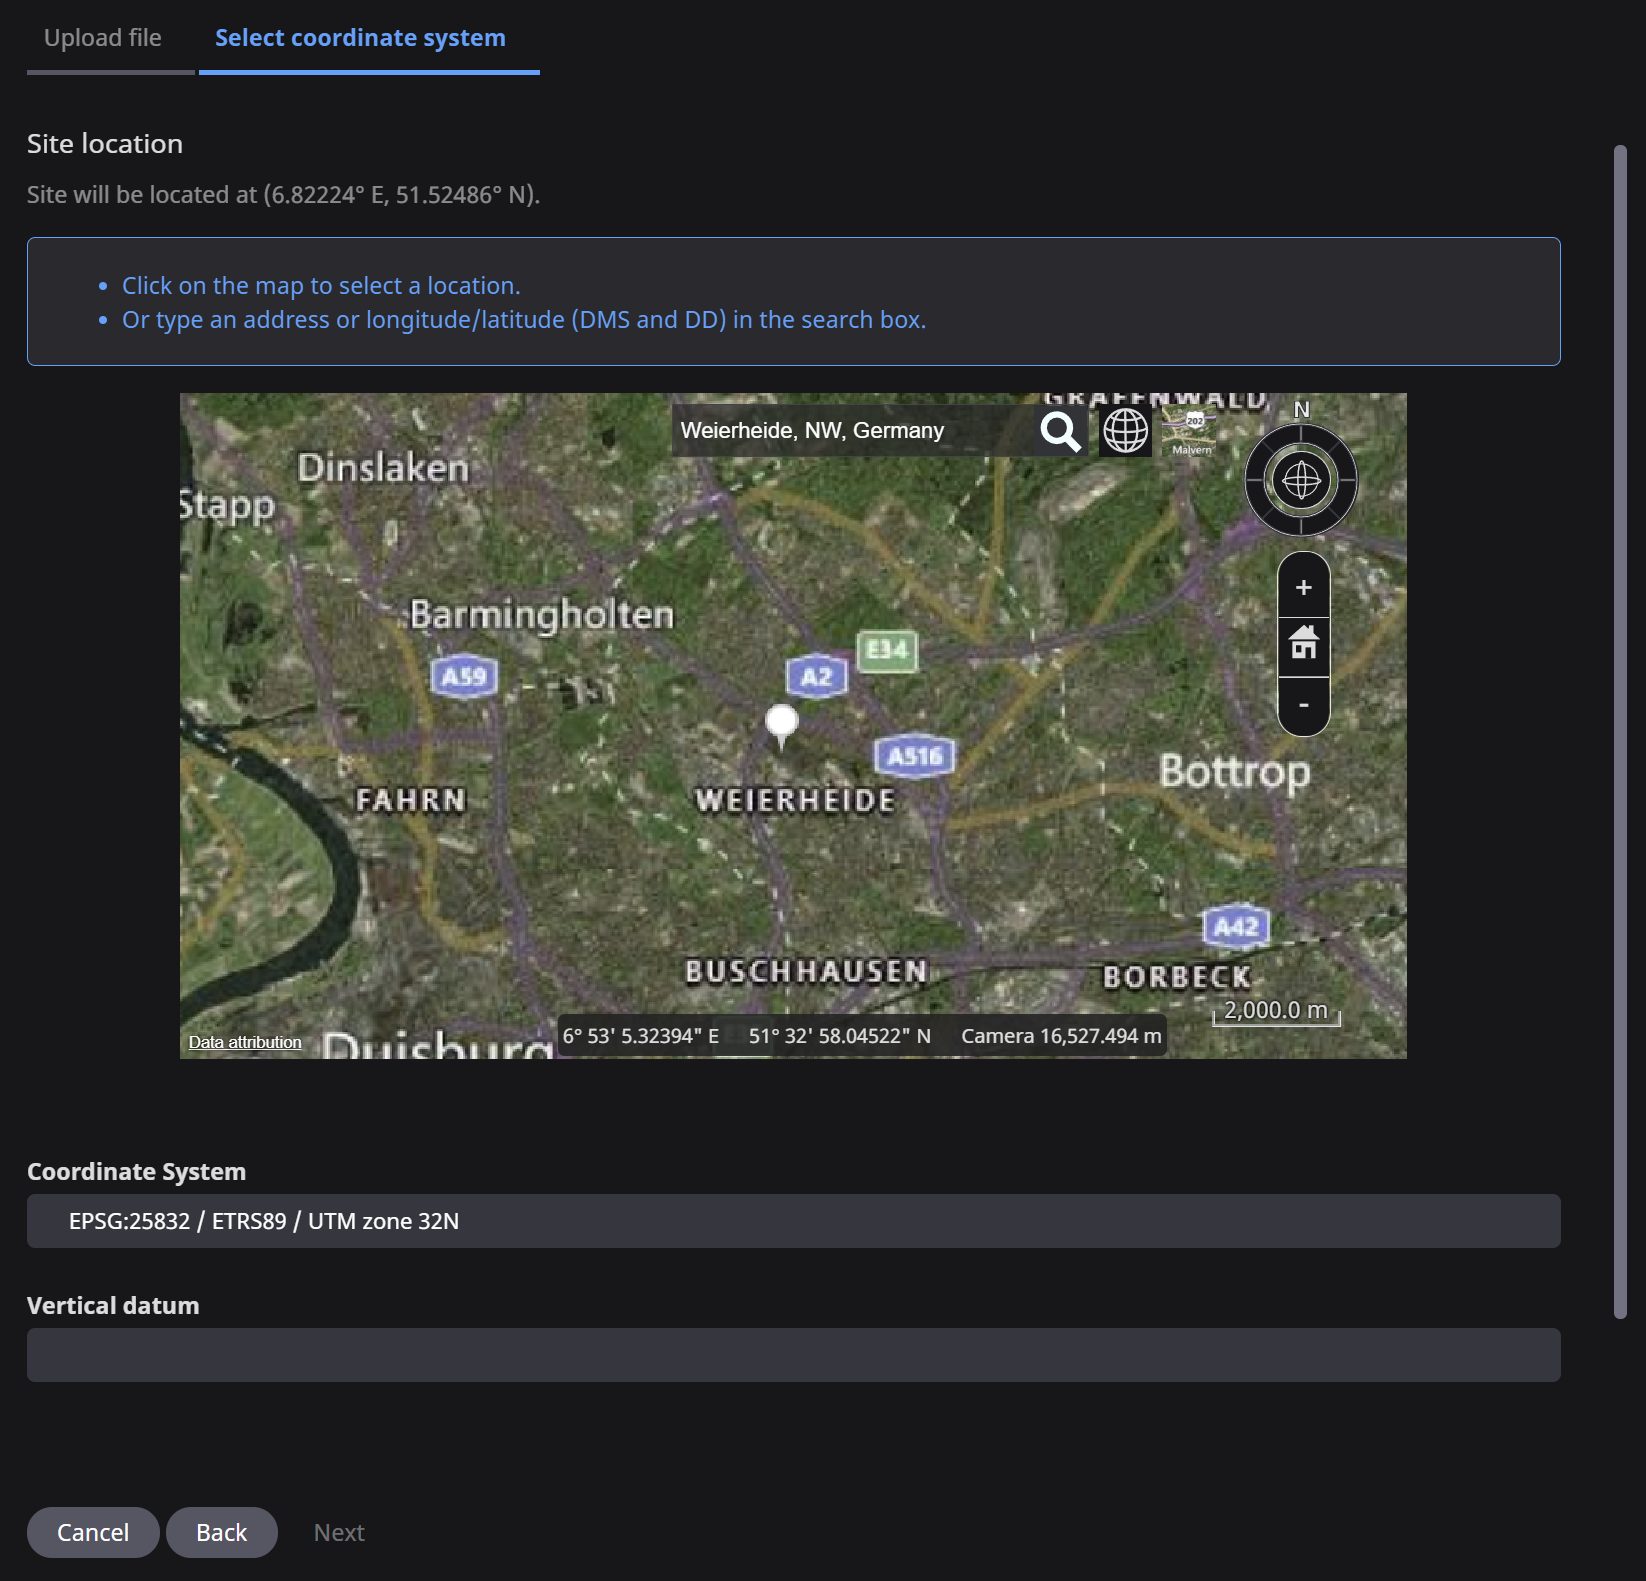
Click Next.
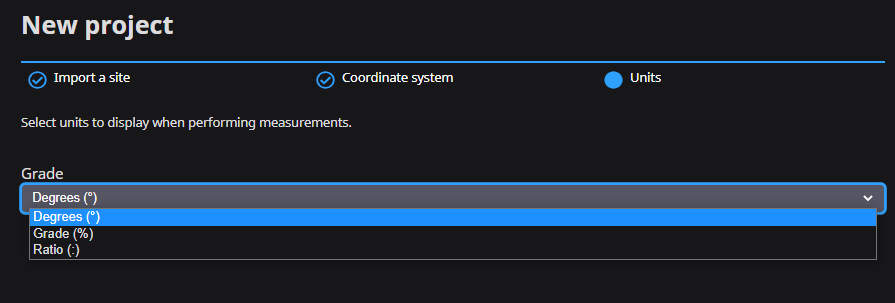
Confirm jobsite units
SC Dashboard imports all of the jobsite units from the Smart Construction site information.
You can select which units for Grade to be displayed when performing measurements –
- Degrees ( ° )
- Grade ( % )
- Ratio ( : )
This can also be changed in the jobsite properties.
Finally, click Create project once you have confirmed your project details.

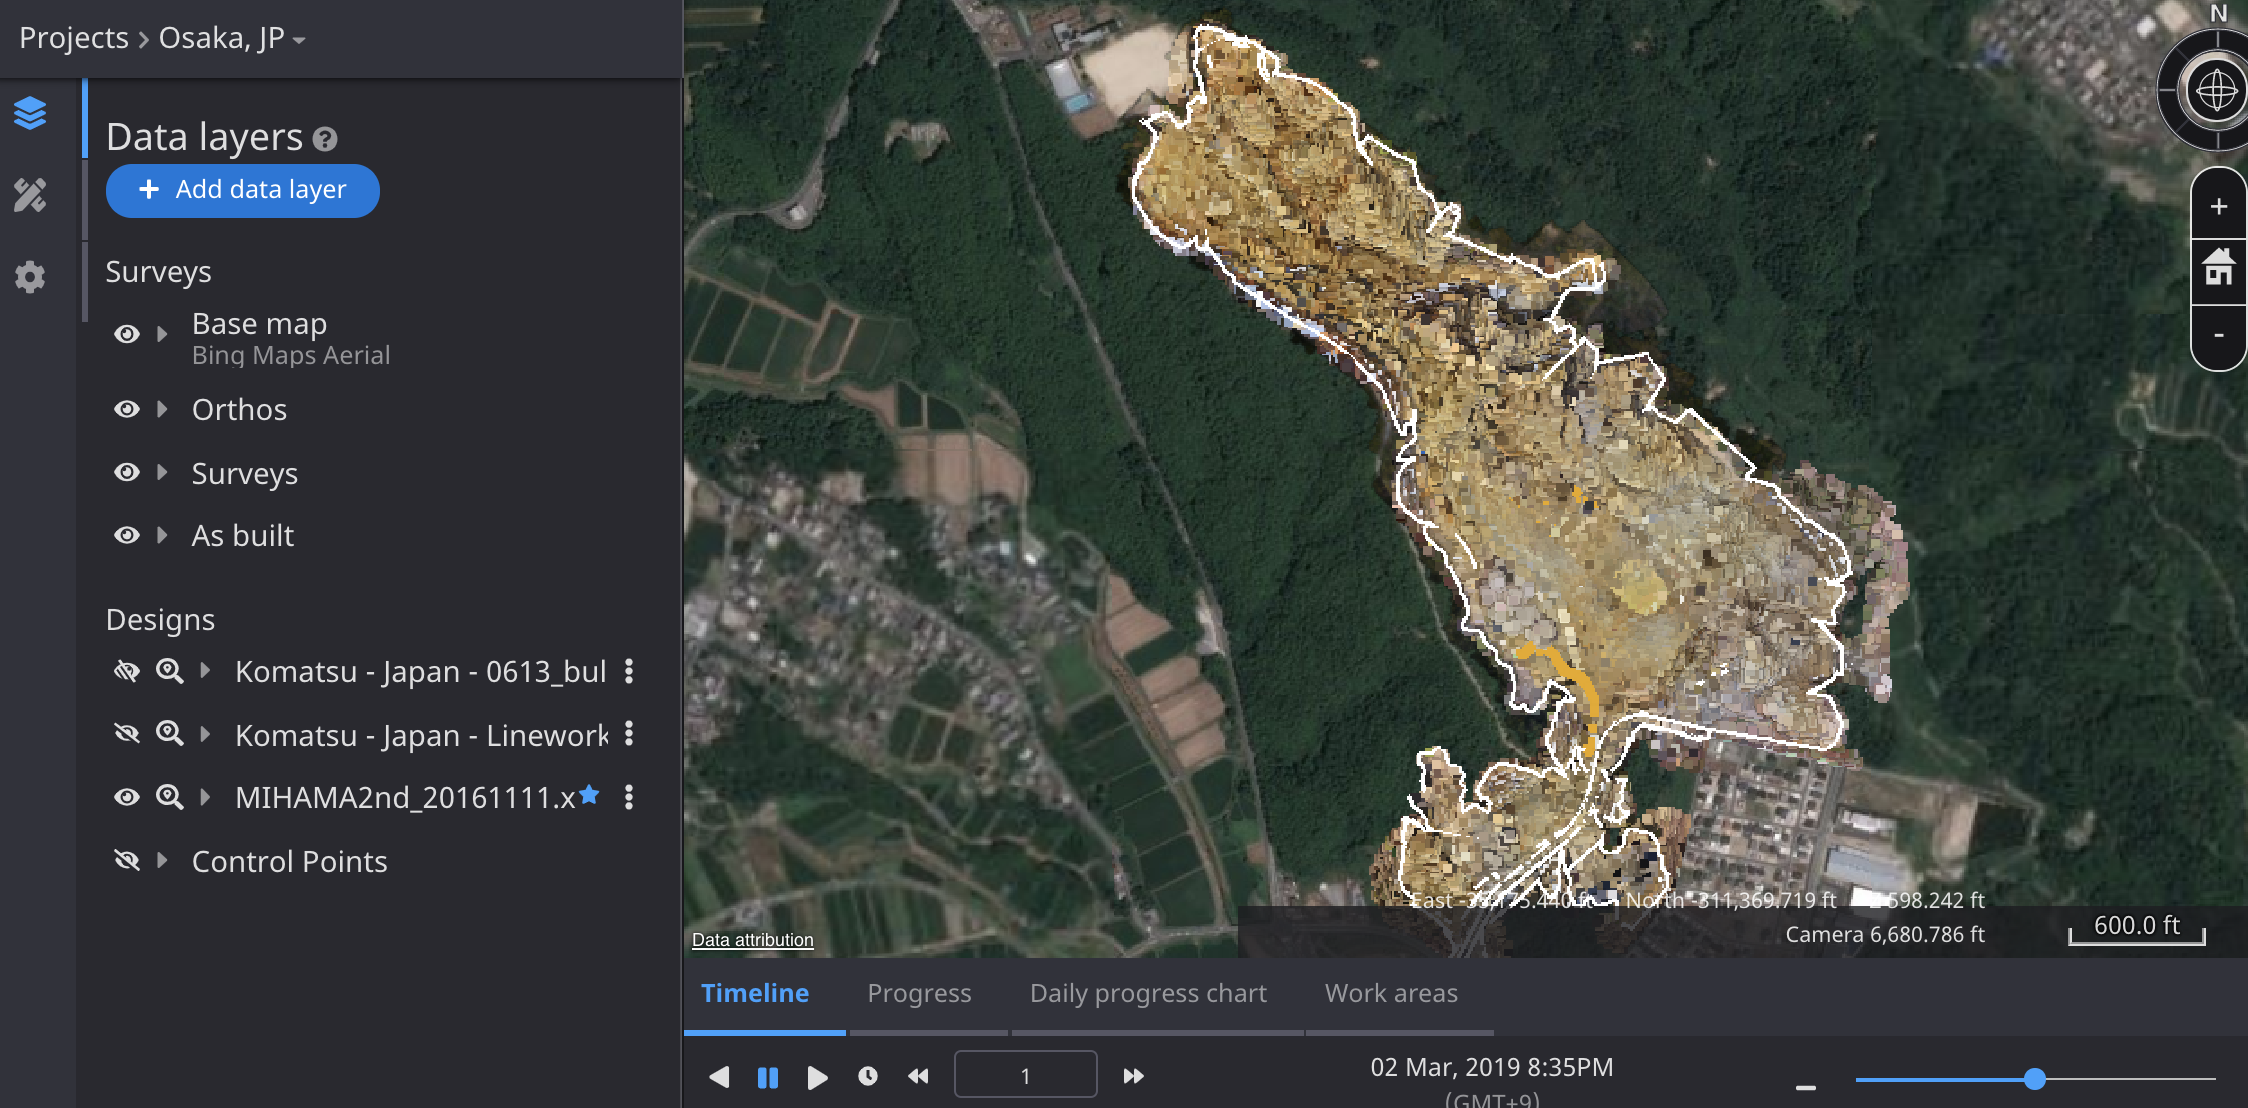
Viewer basics
The viewer allows the user to visualize, measure, and analyze a jobsite that is accessed when you open a project.
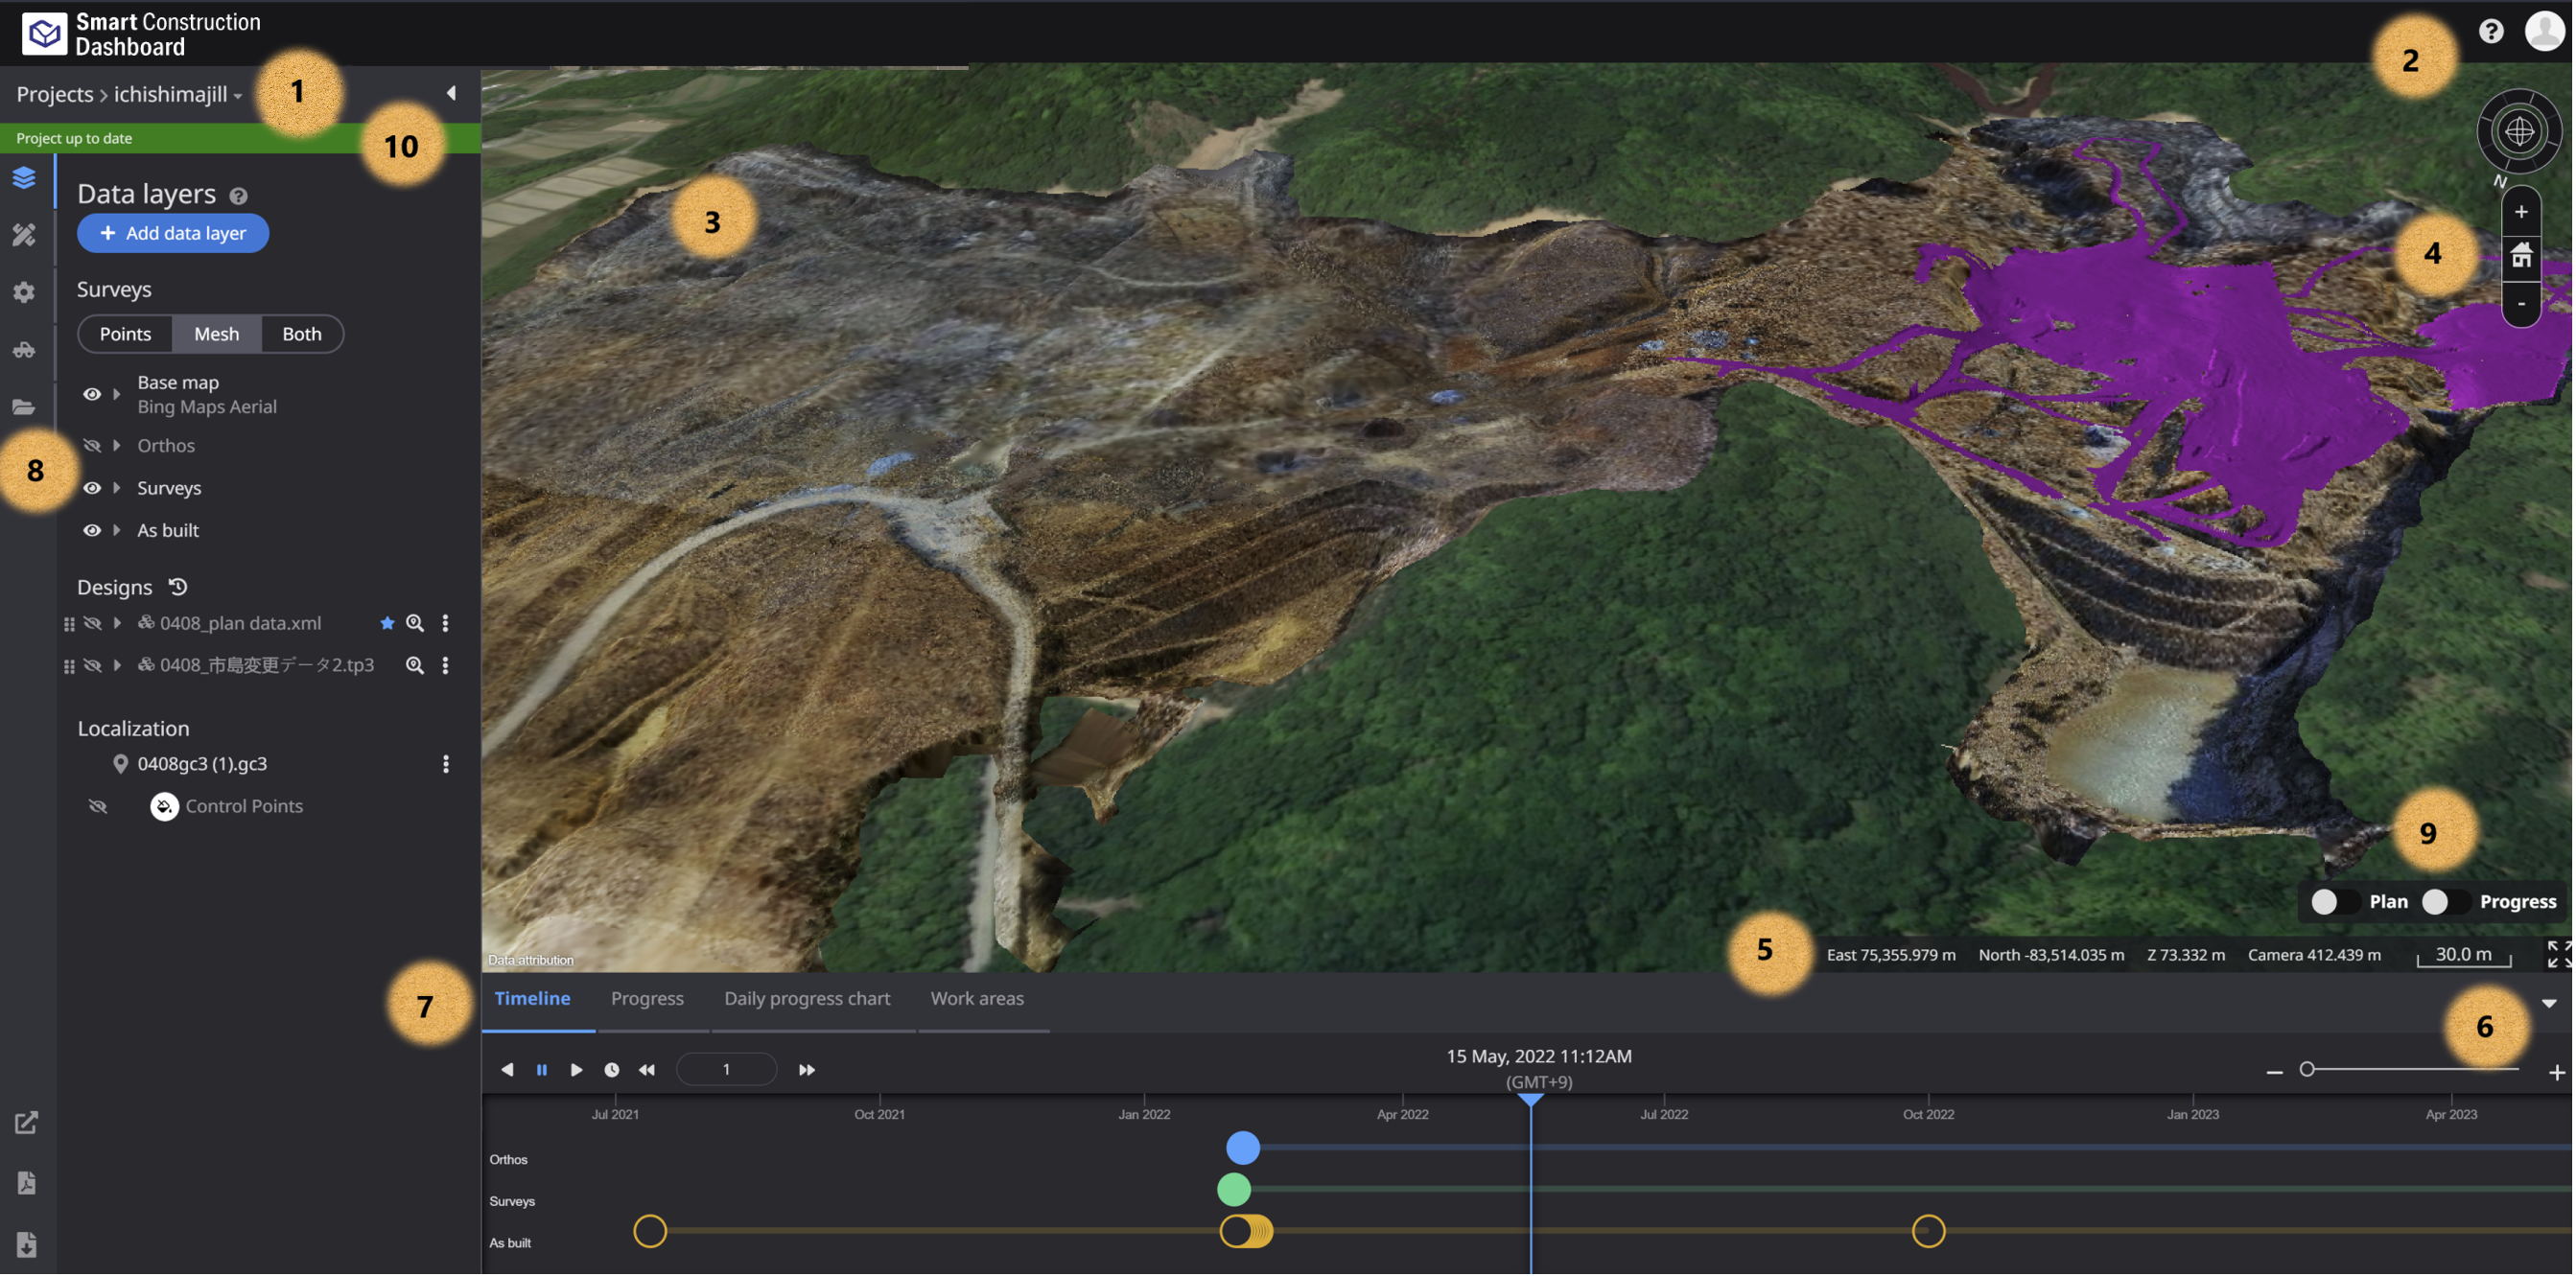
1 Project display - Displays the current project shown in the 3D View.
- Click Projects to return to the project list.
2 User icon - Displays the current signed in Smart Construction user.
3 3D View - Allows you to view, annotate, and measure surface data from your jobsite.
4 Navigation Widget - Allows the user to orient the 3D View.
5 Coordinates and map scale - Displays the pointer coordinates and scale.
6 Fullscreen button - Maximizes the 3D View.
7 Timeline - Controls the current project time and datasets currently displayed.
- See Timeline.
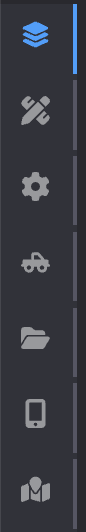
8 Side panel – Provides access to key functions:
- Data Layers - ou can upload and manipulate data related to this project. See Data Layers
- Measurements – Annotations and Measurements. See Annotations and Measurements.
- Settings Panel - Configure properties for the jobsite. See Project Settings.
- Machine file transfers – Access to jobsite machines. See Jobsite Machines
- Project Files – Access and download project files. See Project files.
- Messages - Send instructional messages to the Dashboard Mobile App and view reports from the Mobile App. See Messages
- Measurement Orders - Send measurement order to Smart Construction Rover (R) and see the mesurement result on this menu. See Measurement Orders
- Access External Applications - Access to the supporting applications
- Create PDF Report – Generate PDF reports for the jobsite. See Reporting
- Export Screenshot (PNG) – Generate a screenshot of the current view. See Export Screenshot.

9 Plan & progress cut/fill widgets – Calculates side wide progress of cut & fill soil volumes. See Plan & progress cut/fill widgets
10 Status bar – Displays project status. See Upload and tiling status reporting.
Navigating the 3D View
Within the 3D View, you can navigate and explore the job site using the controls outlined below.
Mouse movements Left click and drag over map to move around the 3D view Right-click and drag to zoom in and zoom out in the 3D view Hold down track-wheel to tilt / rotate the 3D view
Reset the view Click the Home icon in the navigation widget to reset the view.
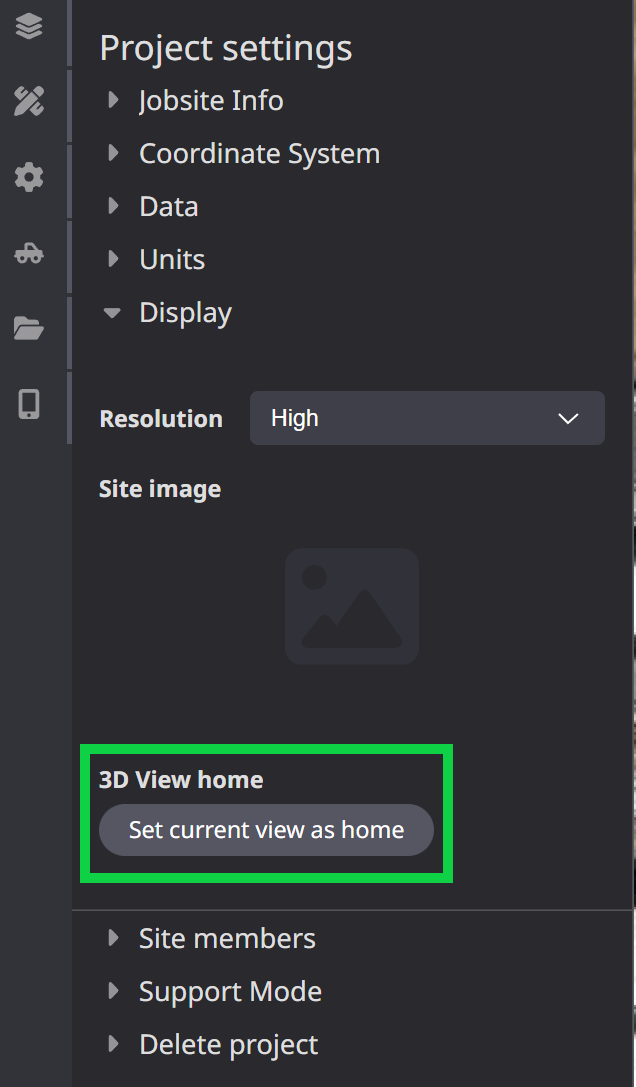
The Home view can be changed in Project settings > Display.
Navigate the map display to the desired extent and view, then click Set current view as home.
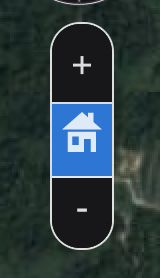
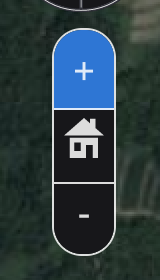
Zoom Right click and drag, scroll with the mouse, or click the + or – buttons on the navigation widget to adjust the zoom.
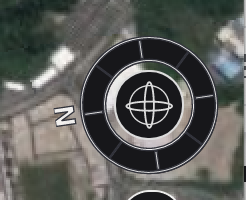
Rotate Click and drag the compass wheel in the navigation widget to rotate the view along the cardinal directions.
Orbit Middle mouse click and drag, or click and drag the gyro in the navigation widget to orbit.
Fullscreen Click the fullscreen button to maximize the 3D View. Collapse Side Panel and Timeline Click on the small arrows to collapse the side panel and timeline individually

Collapse Side Panel and Timeline Click on the small arrows to collapse the side panel and timeline individually
Timeline
The Timeline controls the current project time and controls which datasets are currently displayed in the scene. There are three layers on the timeline: Orthos, Surveys, and As Built (See Data layers).
At the time indicated by the timeline, the most recent time-tagged dataset is displayed for each layer.
To change the time, click and drag the timeline back and forth.
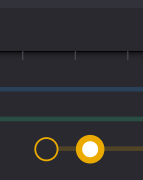
Circles indicate a dataset is available at that time. A filled in circle indicates a dataset is currently being displayed in the 3D View.
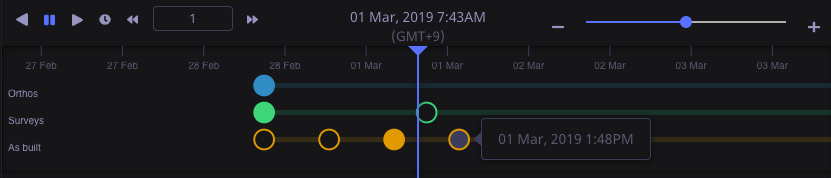
Clicking on a circle will turn on the layer in the 3D View. The icon will be updated with a white center for the selected layer.
Using the timeline, you can:
Modify the current time displayed in the 3D View by clicking and dragging the timeline back and forth.
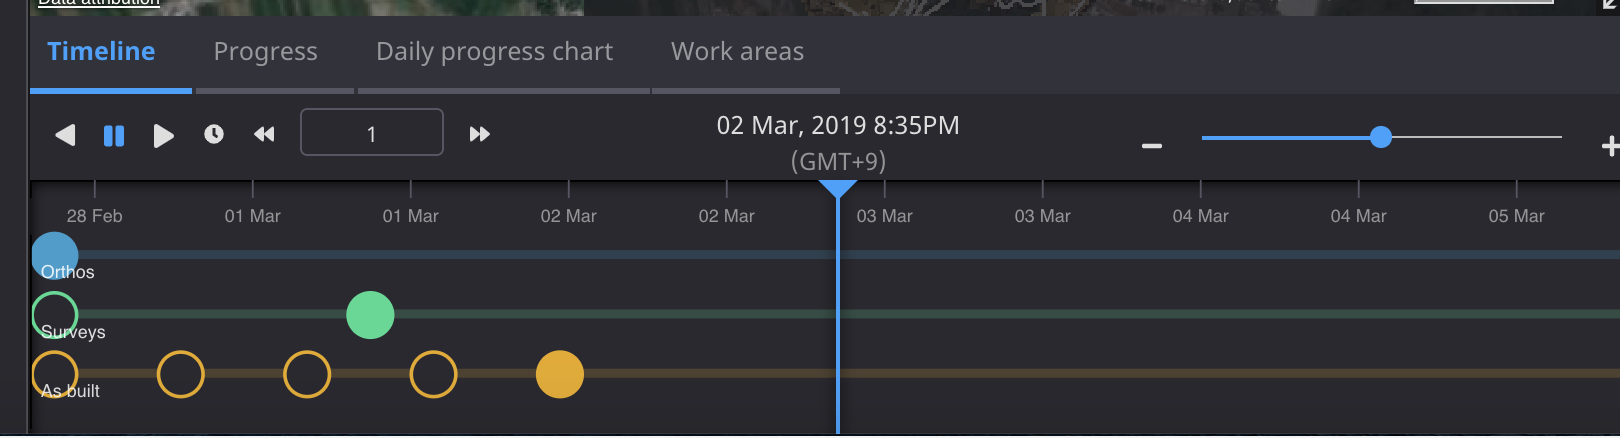
Adjust the scale of the timeline by dragging the slider.

Play, pause, or reverse playback.

Speedup or slowdown playback speed.

Set to the current time.

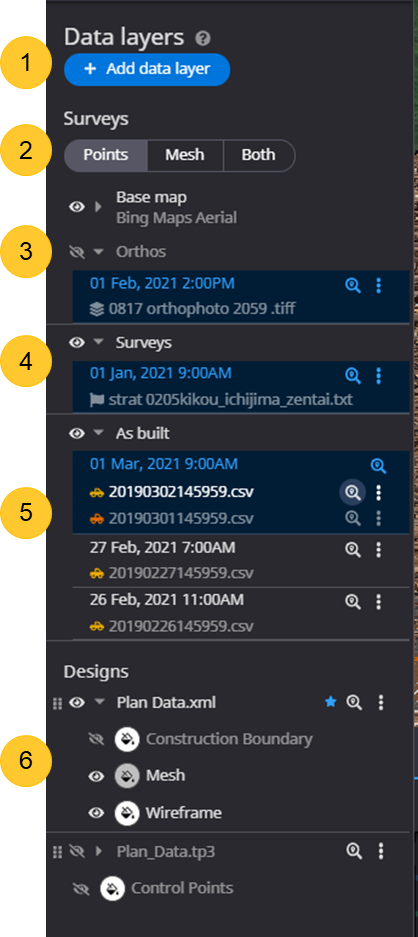
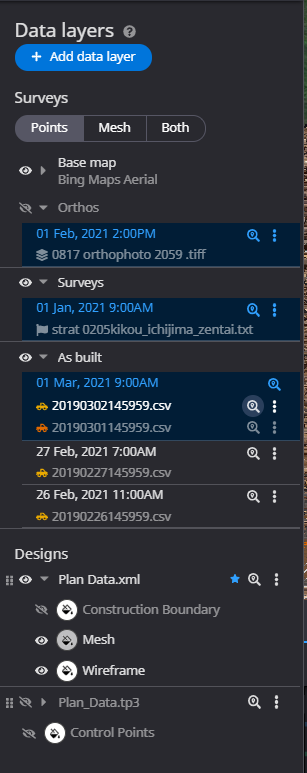
Data layers
The Data layers tab contains the list of data layers for this project. Each data layer contains a dataset such as a survey or design surface. You can turn on or off data layers in the 3D View. Some data layers, including Orthos, Surveys, and As Built layers, update with the current time in the 3D View and are displayed according to the time tag assigned to each dataset.
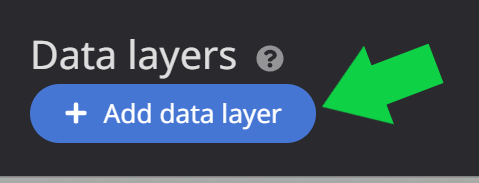
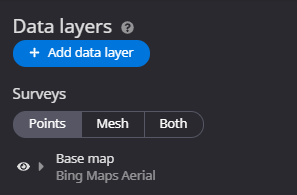
- Add data layer – Add new data layers. See Uploading Data
- Basemap – Control display of surface. See Surface Display
- Surveys – Project survey layers. See Surveys
- As Built – Project As Built layers. See As Built
- Designs – Project Design layers. See Designs and Control Points
- Building Designs - Layer for structural design data (BIM Data) for bridges and other structures. See Building Designs
- Localization - Layer of the localization file that defines the local coordinate system for the project. See Localization
Common Layer Capabilities
Active Layers
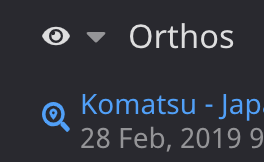
Layers currently displayed in the 3D View are highlighted in blue.
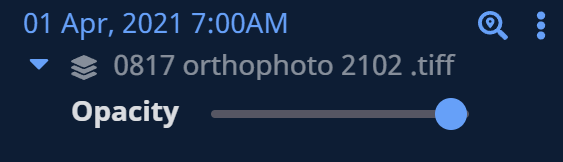
Toggle visibility Click the eye icon to toggle the data layer visibility in the 3D View.


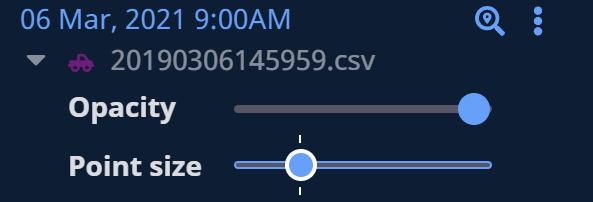
Opacity Click and drag the opacity slider to adjust levels of transparency of that layer in the 3D view from 0-100%.
Point size Click and drag the point size slider to adjust the side of the points in a point cloud or As Built layer displayed in the 3D View.
Zoom to data Zoom to data in the 3D View by clicking the zoom to icon. This will also adjust the currently displayed time so that the data is visible.

Expand and Collapse Data layer groups. Click the caret icon to toggle layer details. The layer details are a list of datasets that were added to the layer.
Adjust layer color Some layers, such as design surfaces and linework, have an adjustable color. Click the color selector to choose a new color.

For information on how to add a new data layer, see Add data to your project.
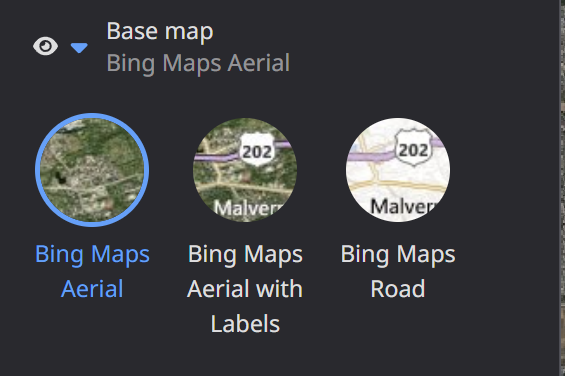
Base map
The Base map layer group controls the base layer displayed in the 3D View. The base map, or base layer, is the underlying map shown in the 3D View.
Orthos
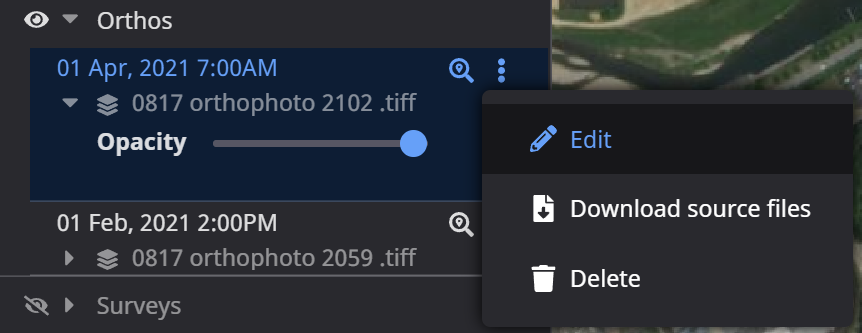
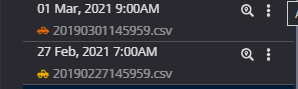
The Orthos layer group contains all ortho photos uploaded or imported into the Dashboard project. Edit – Allows you to change the name of the layer. This does not change the file name of the ortho photo. Download source files – Download source files you have access to Delete – Deletes the layer from the Dashboard project. If the data was imported, this will not delete the source data.
Surveys
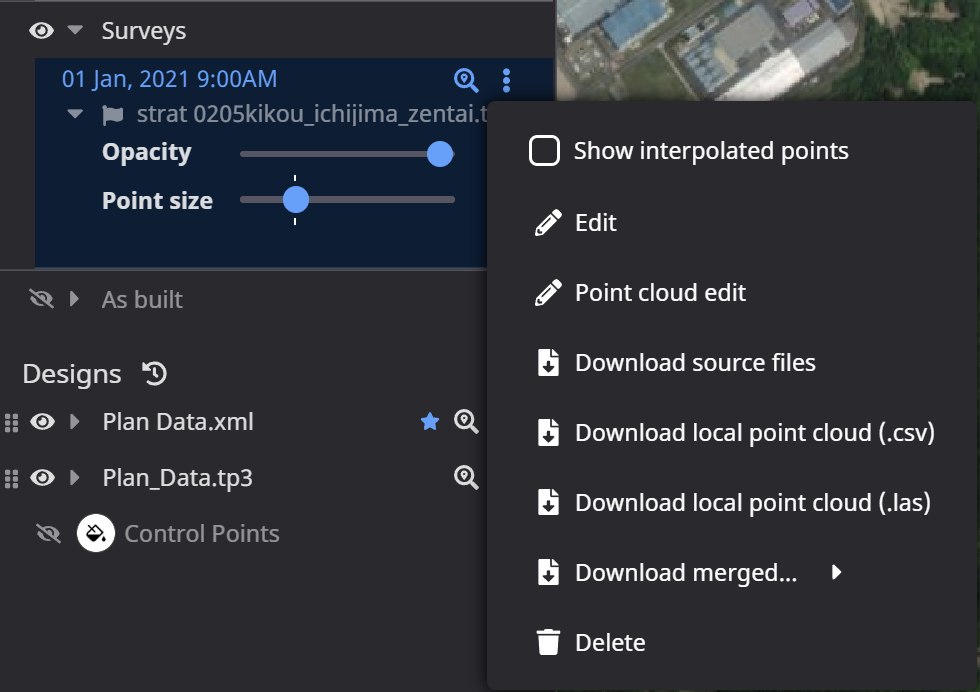
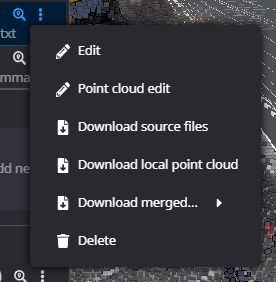
The Surveys layer group contains all survey data uploaded or imported into the Dashboard project.Show interpolated points – display locations in the survey that were interpolated during upload.Edit – Allows you to change the name of the layer. Does not change the source file name.Point cloud edit – Allows you to edit the point cloud to remove objects or anomalies. See Editing survey data.Download source files – Download source files you have access to.Download local point cloud – Downloads the survey in a .LAS format using the local projection system of the project.Download merged – Downloads a merged XML surface at the selected resolution - .5m, 1.0m and 2.0mDelete – Deletes the layer from the Dashboard project. If the data was imported, it will not delete the source data.
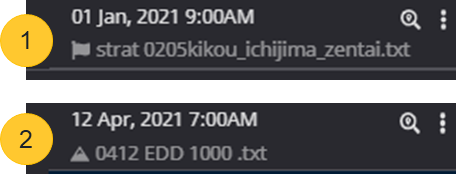
Survey Types 1. Pre-construction survey – Initial survey 2. Survey – All other survey data layers
As Built
The As Built layer group contains all As Built data uploaded or imported into the Dashboard project.Edit – Allows you to change the name of the layer. This does not change the source file name.Download merged – Downloads a merged XML surface at the selected resolution - .5m, 1.0m and 2.0mDelete – Deletes the layer from the Dashboard project. If the data was imported, this will not delete the source data.
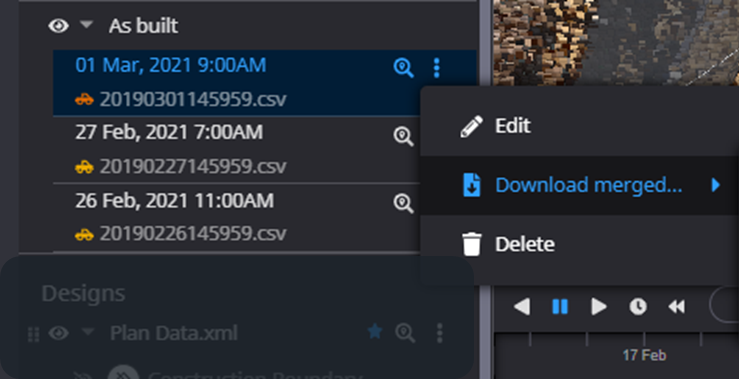
As Built types – The dashboard support multi-types of As Built data. Each type has a unique color in both the Data Layers and 3D View 3DMG – Orange icon/color ICT Type – Yellow icon/color Manual upload - Purple icon/color
Designs
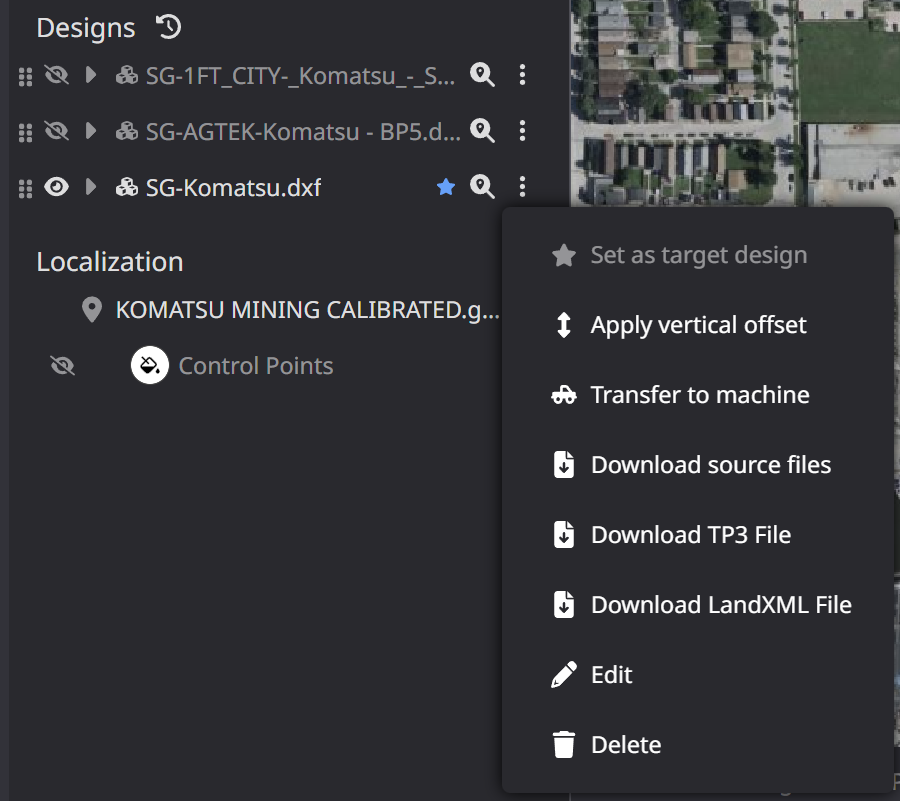
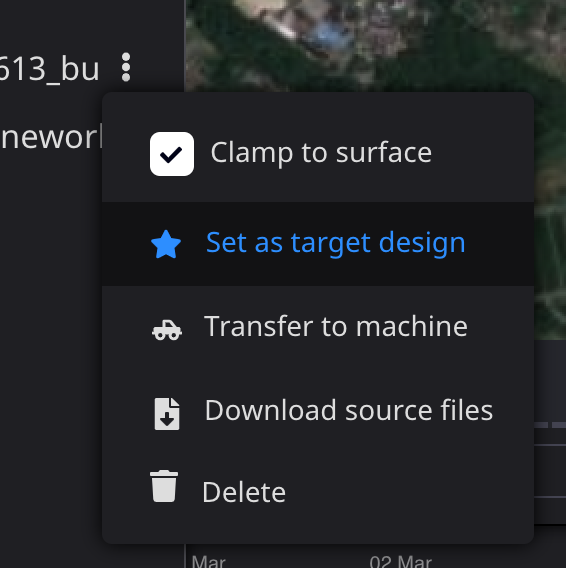
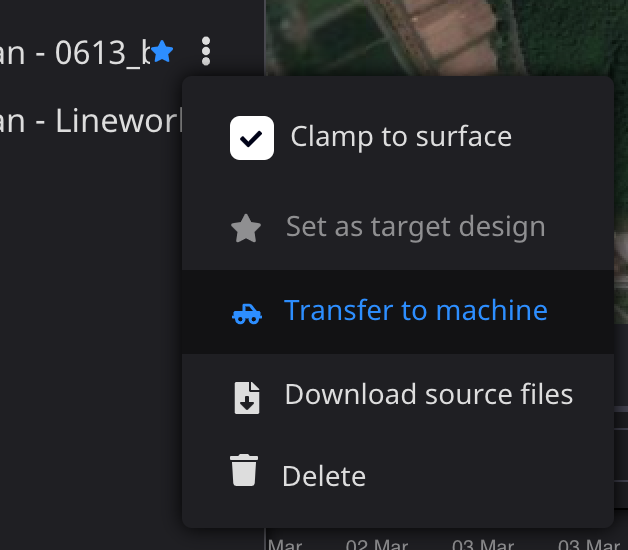
The Designs layer group contains all design data uploaded or imported into the Dashboard project. View Target Design History - Allows you to view the history of changes to the Target Design layer in the project. See Target Design HistorySet as target design – Sets the selected design layer as the target design. The target design is used for progress and daily progress measurements. The current target design is indicated by a Apply vertical offset – Offsets design files by a positive or negative distance set by the user. Creates a new design layer. Edit vertical offset – Once an offset layer is created the distance value can be edited. Clamp to surface – Clamps the selected design layer to the current surface. This may be disabled for some design layers. Transfer to machine – Allows you to transfer the selected design file to machines assigned on the jobsite. Download source files – Download source files you have access to. Download TP3 File – Allows you to download a TP3 version of the file (XML and DXF only) Download XML File – Allows you to download an XML version of the file (TP3 and DXF only) Edit – Allows you to change the name of the layer. This does not change the source file name. Delete – Deletes the layer from the Dashboard project. If the data was imported, this will not delete the source data.
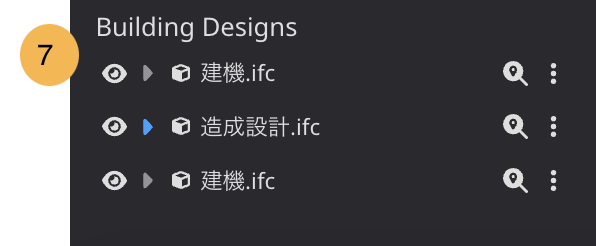
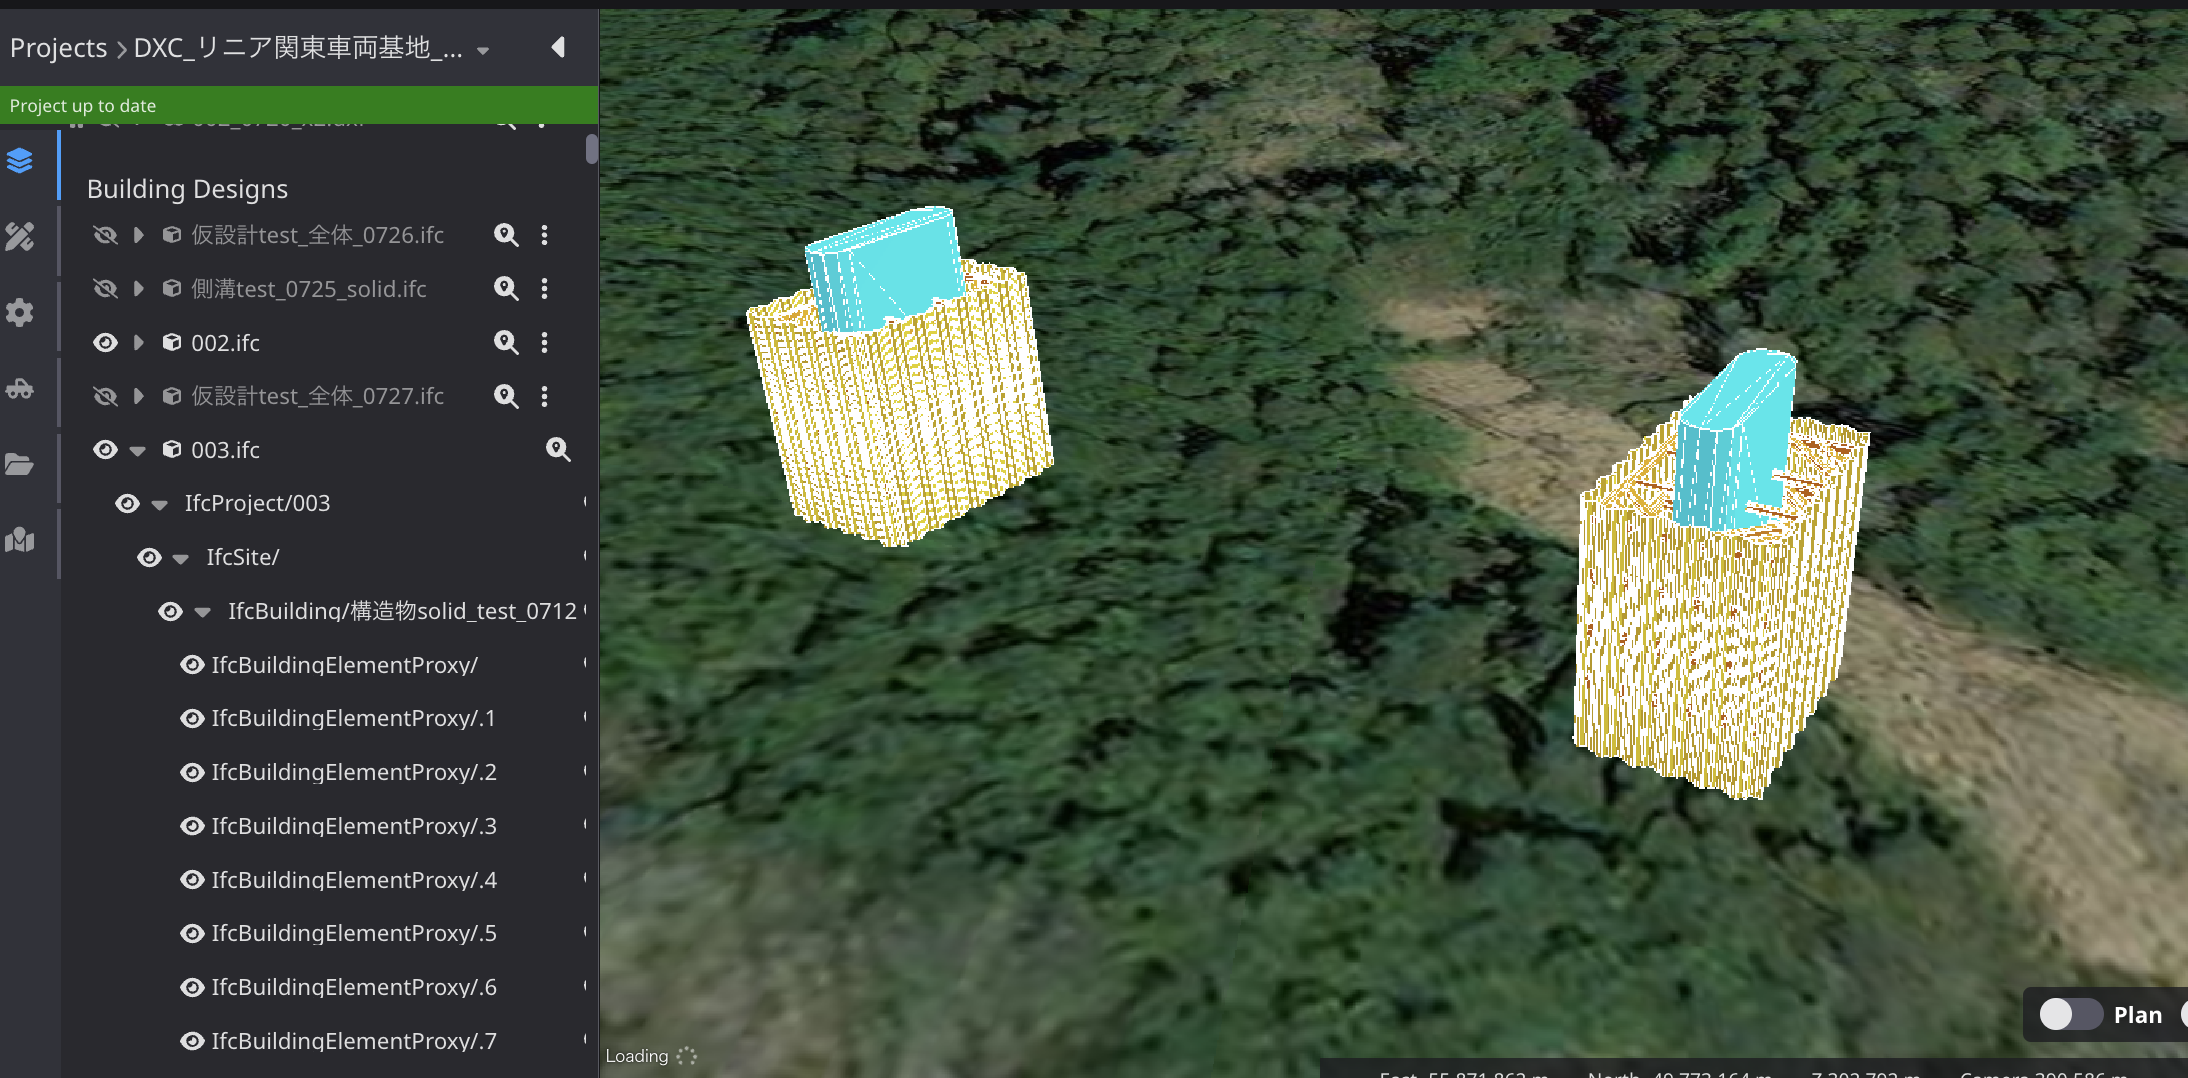
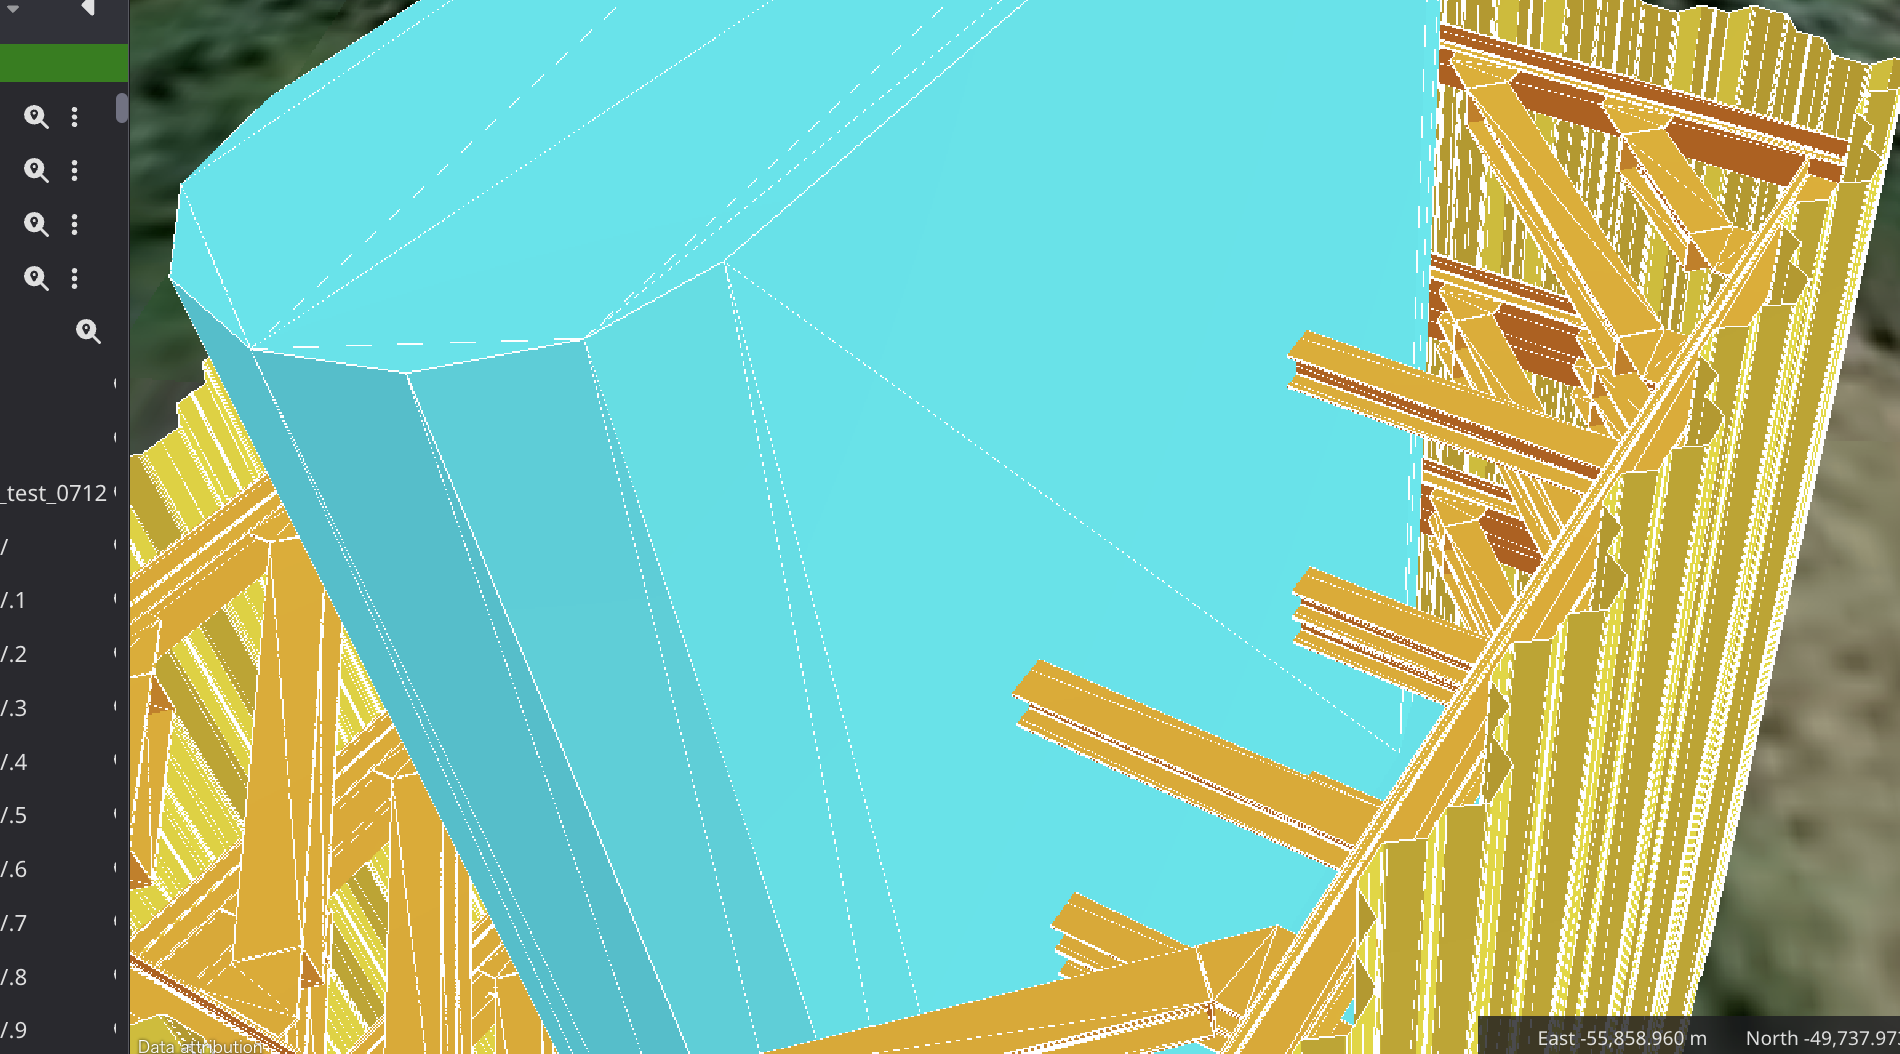
Building Designs
Building Design layer contains the components of structures design data in a layered format. It is possible to show/hide or zoom the parts arranged in each level of layers.
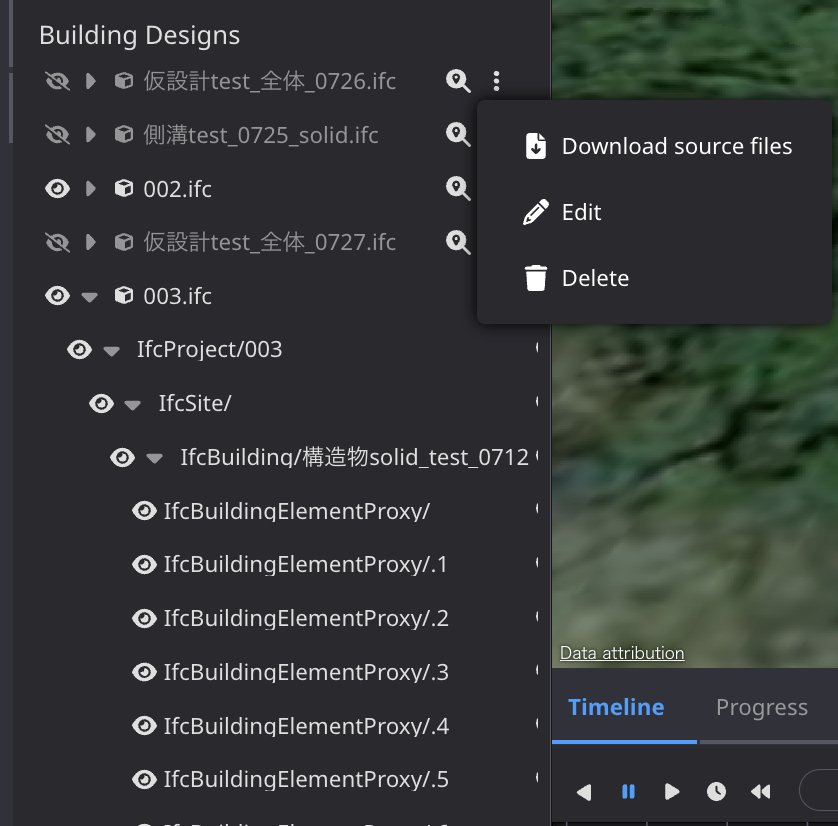
Download source files - Download source file
Edit - Change layer name. Default layer name is the same as source file name. File CRS also able to change if Dashboard applied the wrong CRS when read the file.
Delete - Delete the uploaded data.
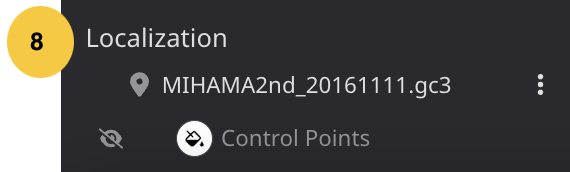
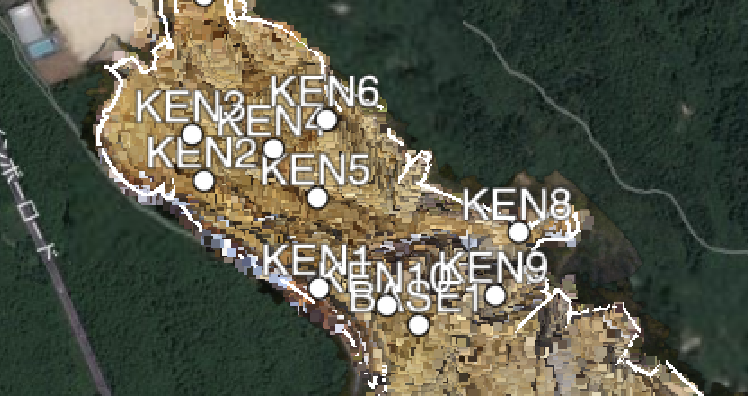
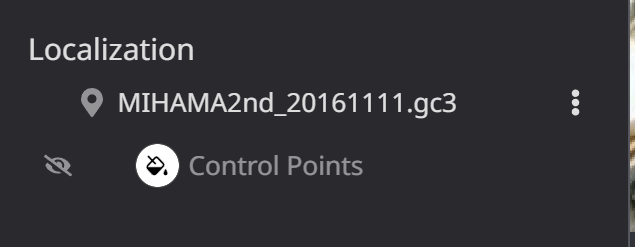
Localization
The localizatoin layer contains the control points data included in the localization file uploaded during project creation.
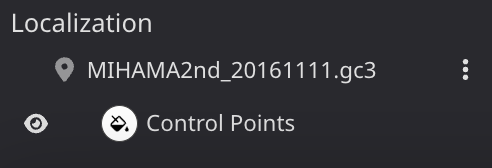
The control point positions are displayed and labeled in the 3D View.
You can show/hide or change the color of Control Points here.
About Target design and Pre-construction survey layers
Within a Dashboard project, there are two primary layers used for measurements and reporting.
The Pre-construction survey is a survey of the jobsite prior to the start of construction. There can only be one pre-construction survey per Dashboard project. This can only be changed by deleting and re-uploading a new pre-construction survey layer.
The Target design is a Design layer that represents the final design of the jobsite. The Target design can be changed to any Design layer loaded into the Dashboard project.
Automated sitewide measurements
The Target design and Pre-construction survey are used to calculate overall jobsite progress and daily progress. This information is displayed In the Progress and Daily progress chart tabs along the bottom of the 3D View.
Important – Changing the Target Design or Pre-construction survey will result in re-tiling of all project layers and a re-calculation of the Progress and Daily progress chart measurements.
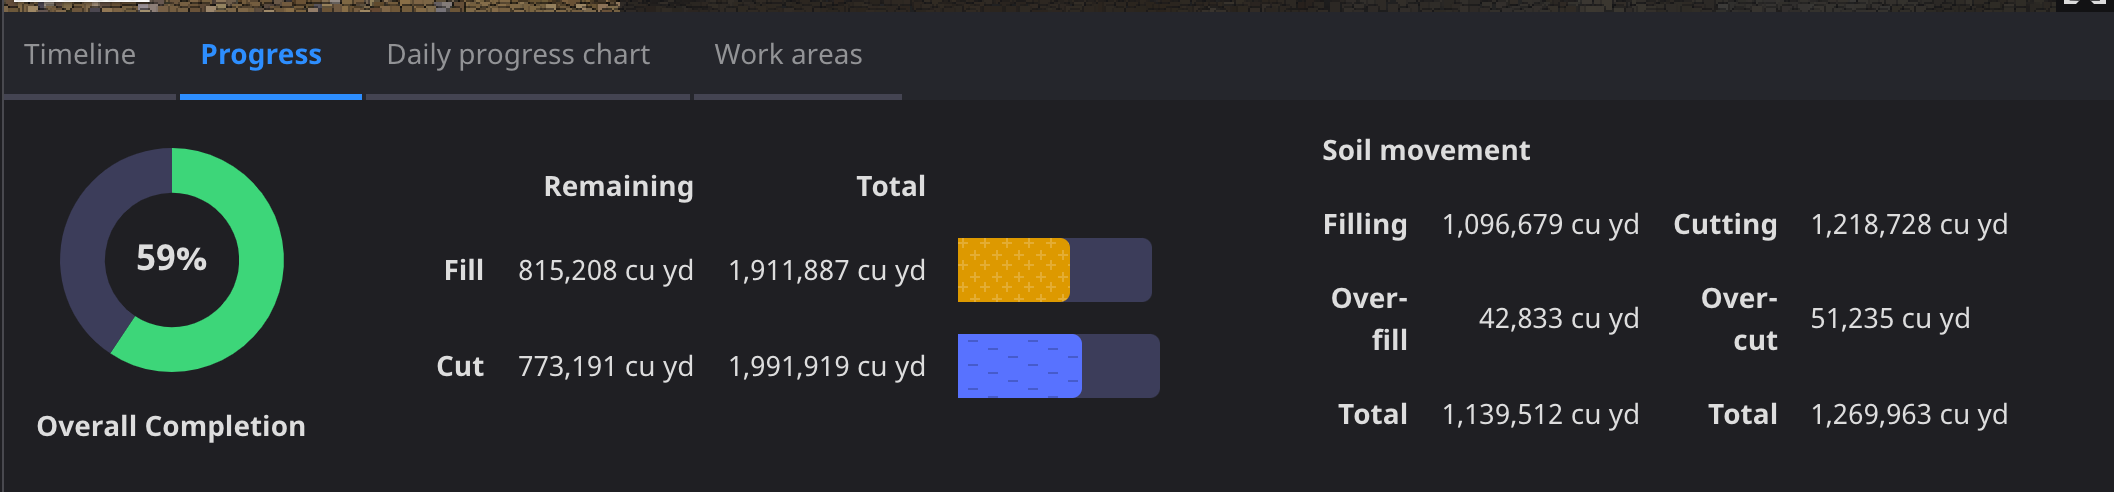
Plan & progress cut/fill widgets
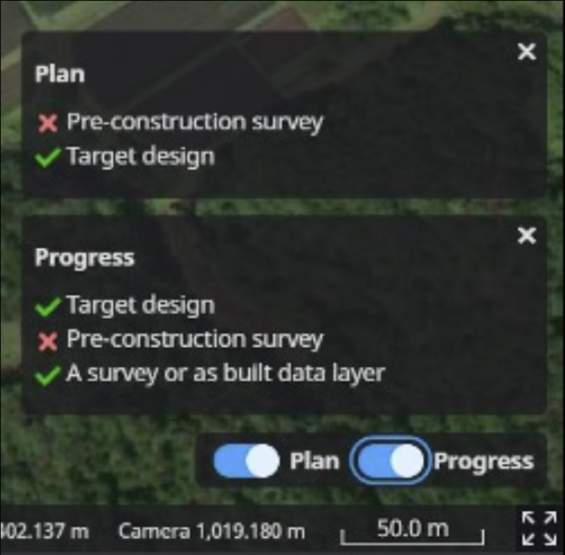
In the bottom right corner of the map view are plan and progress widgets. To calculate progress, the following are required: target design, pre-construction survey, and a survey or As Built data layer.
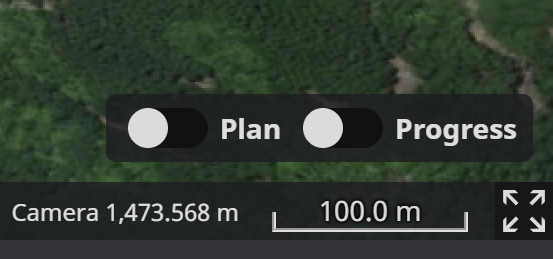
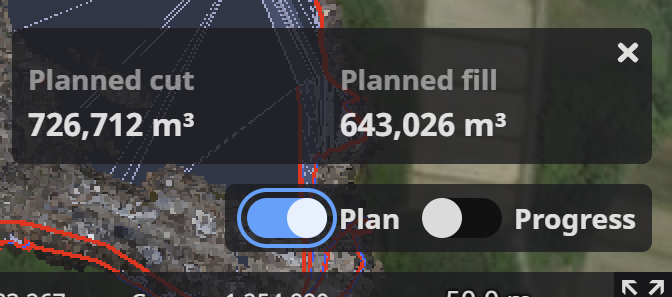
The plan widget will show planned cut soil volume and planned fill soil volume.
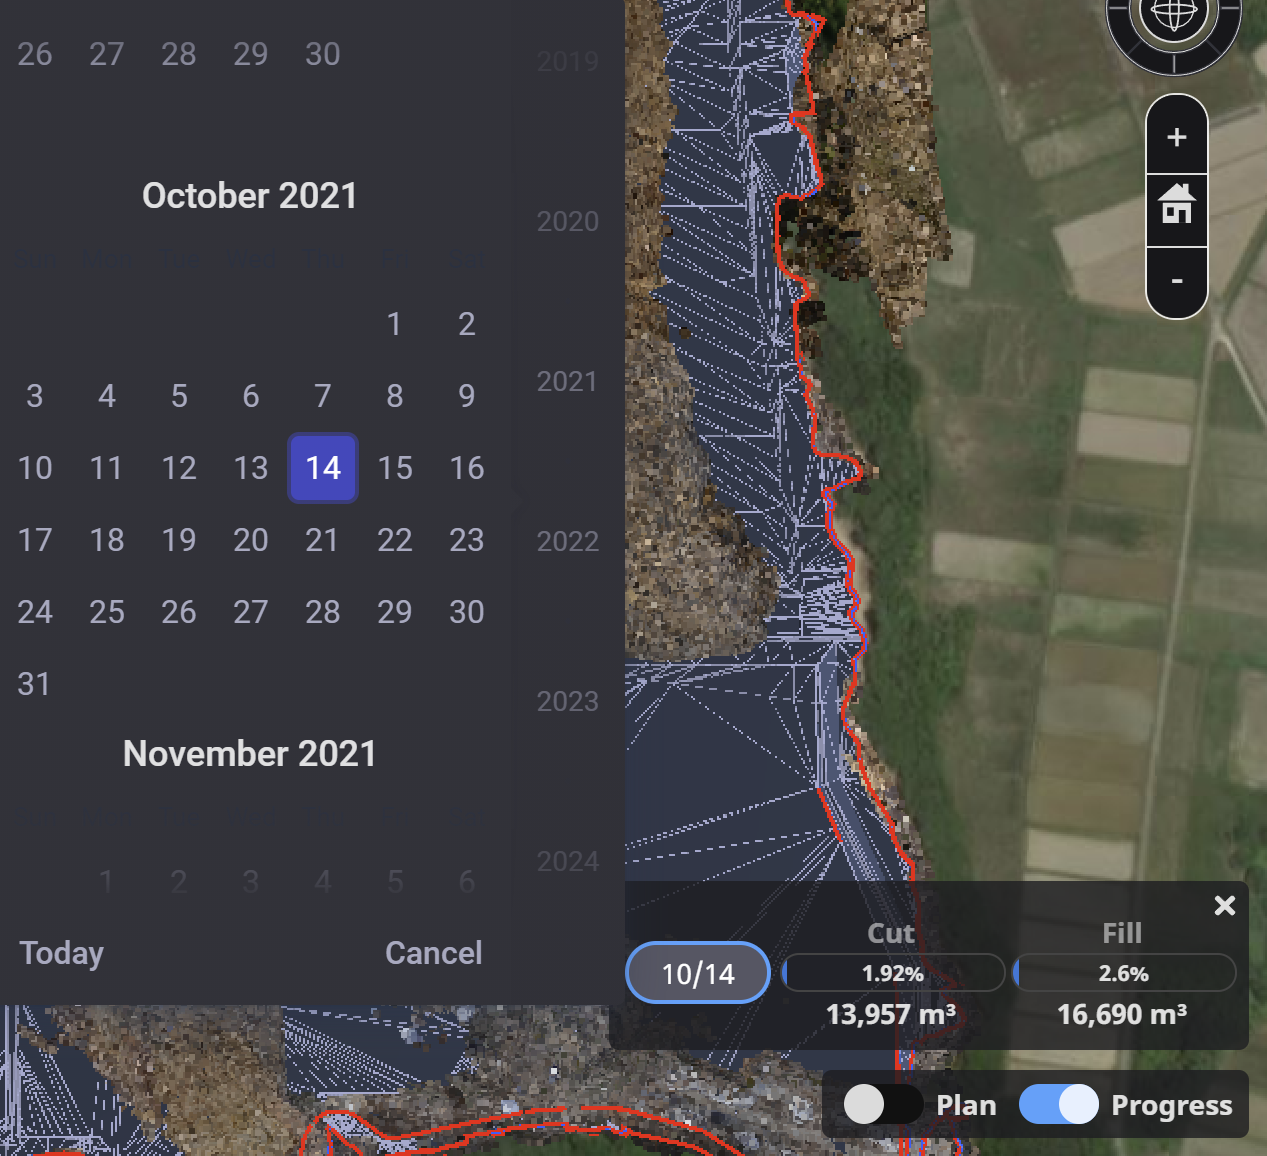
The progress widget shows the cut & fill soil volume and % progress on the site based on the current date, or the date selected in the calendar picker.
If the required data is not set, a notice will be displayed for each file still needed.
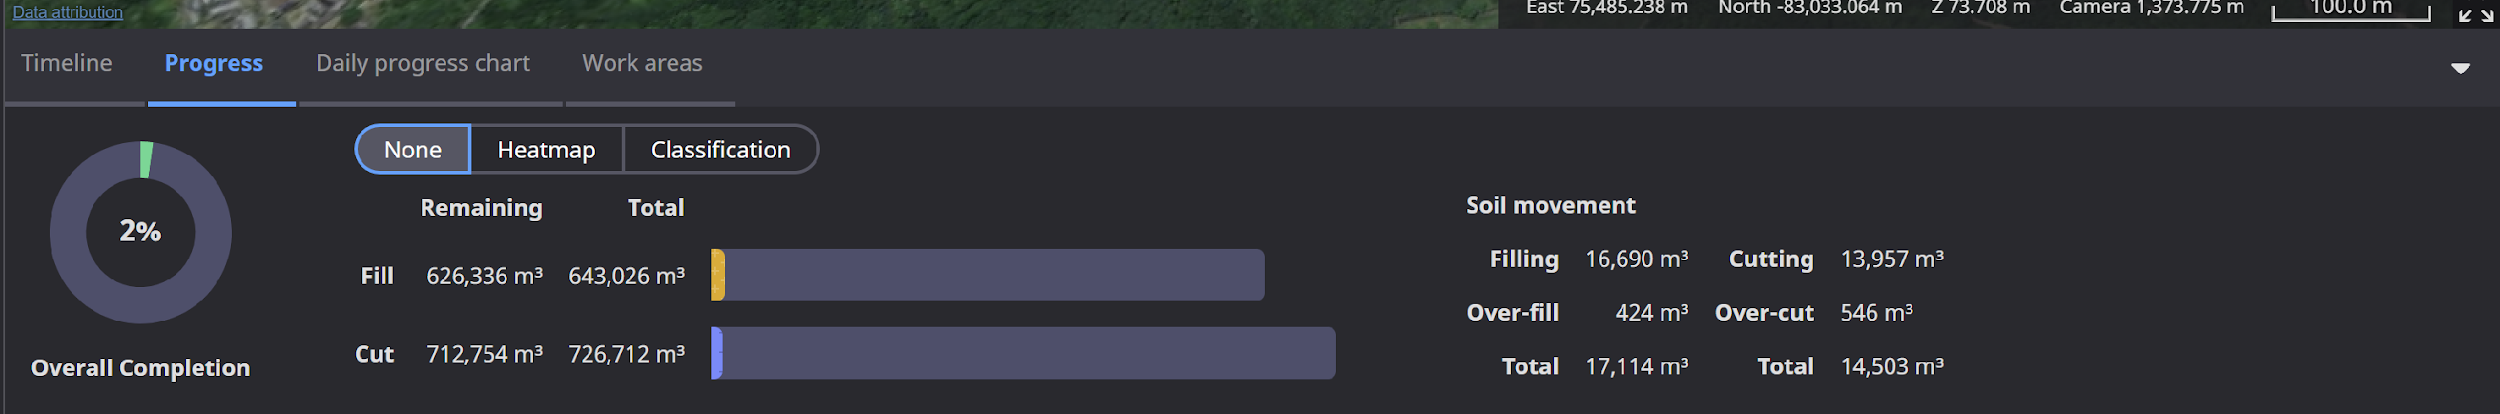
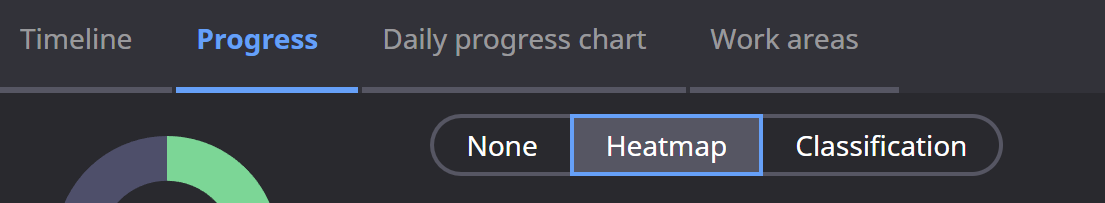
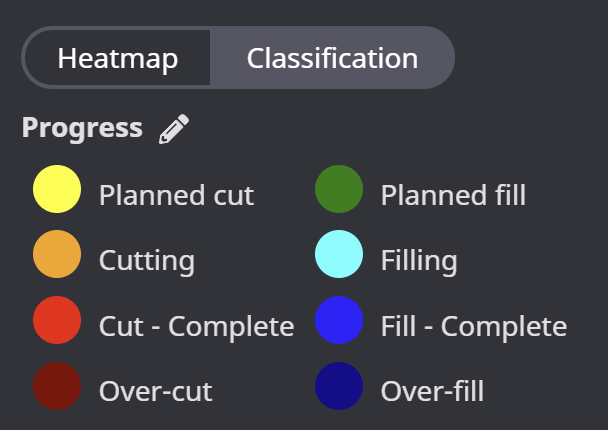
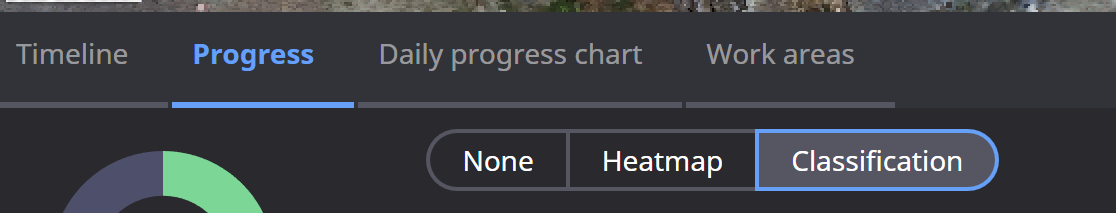
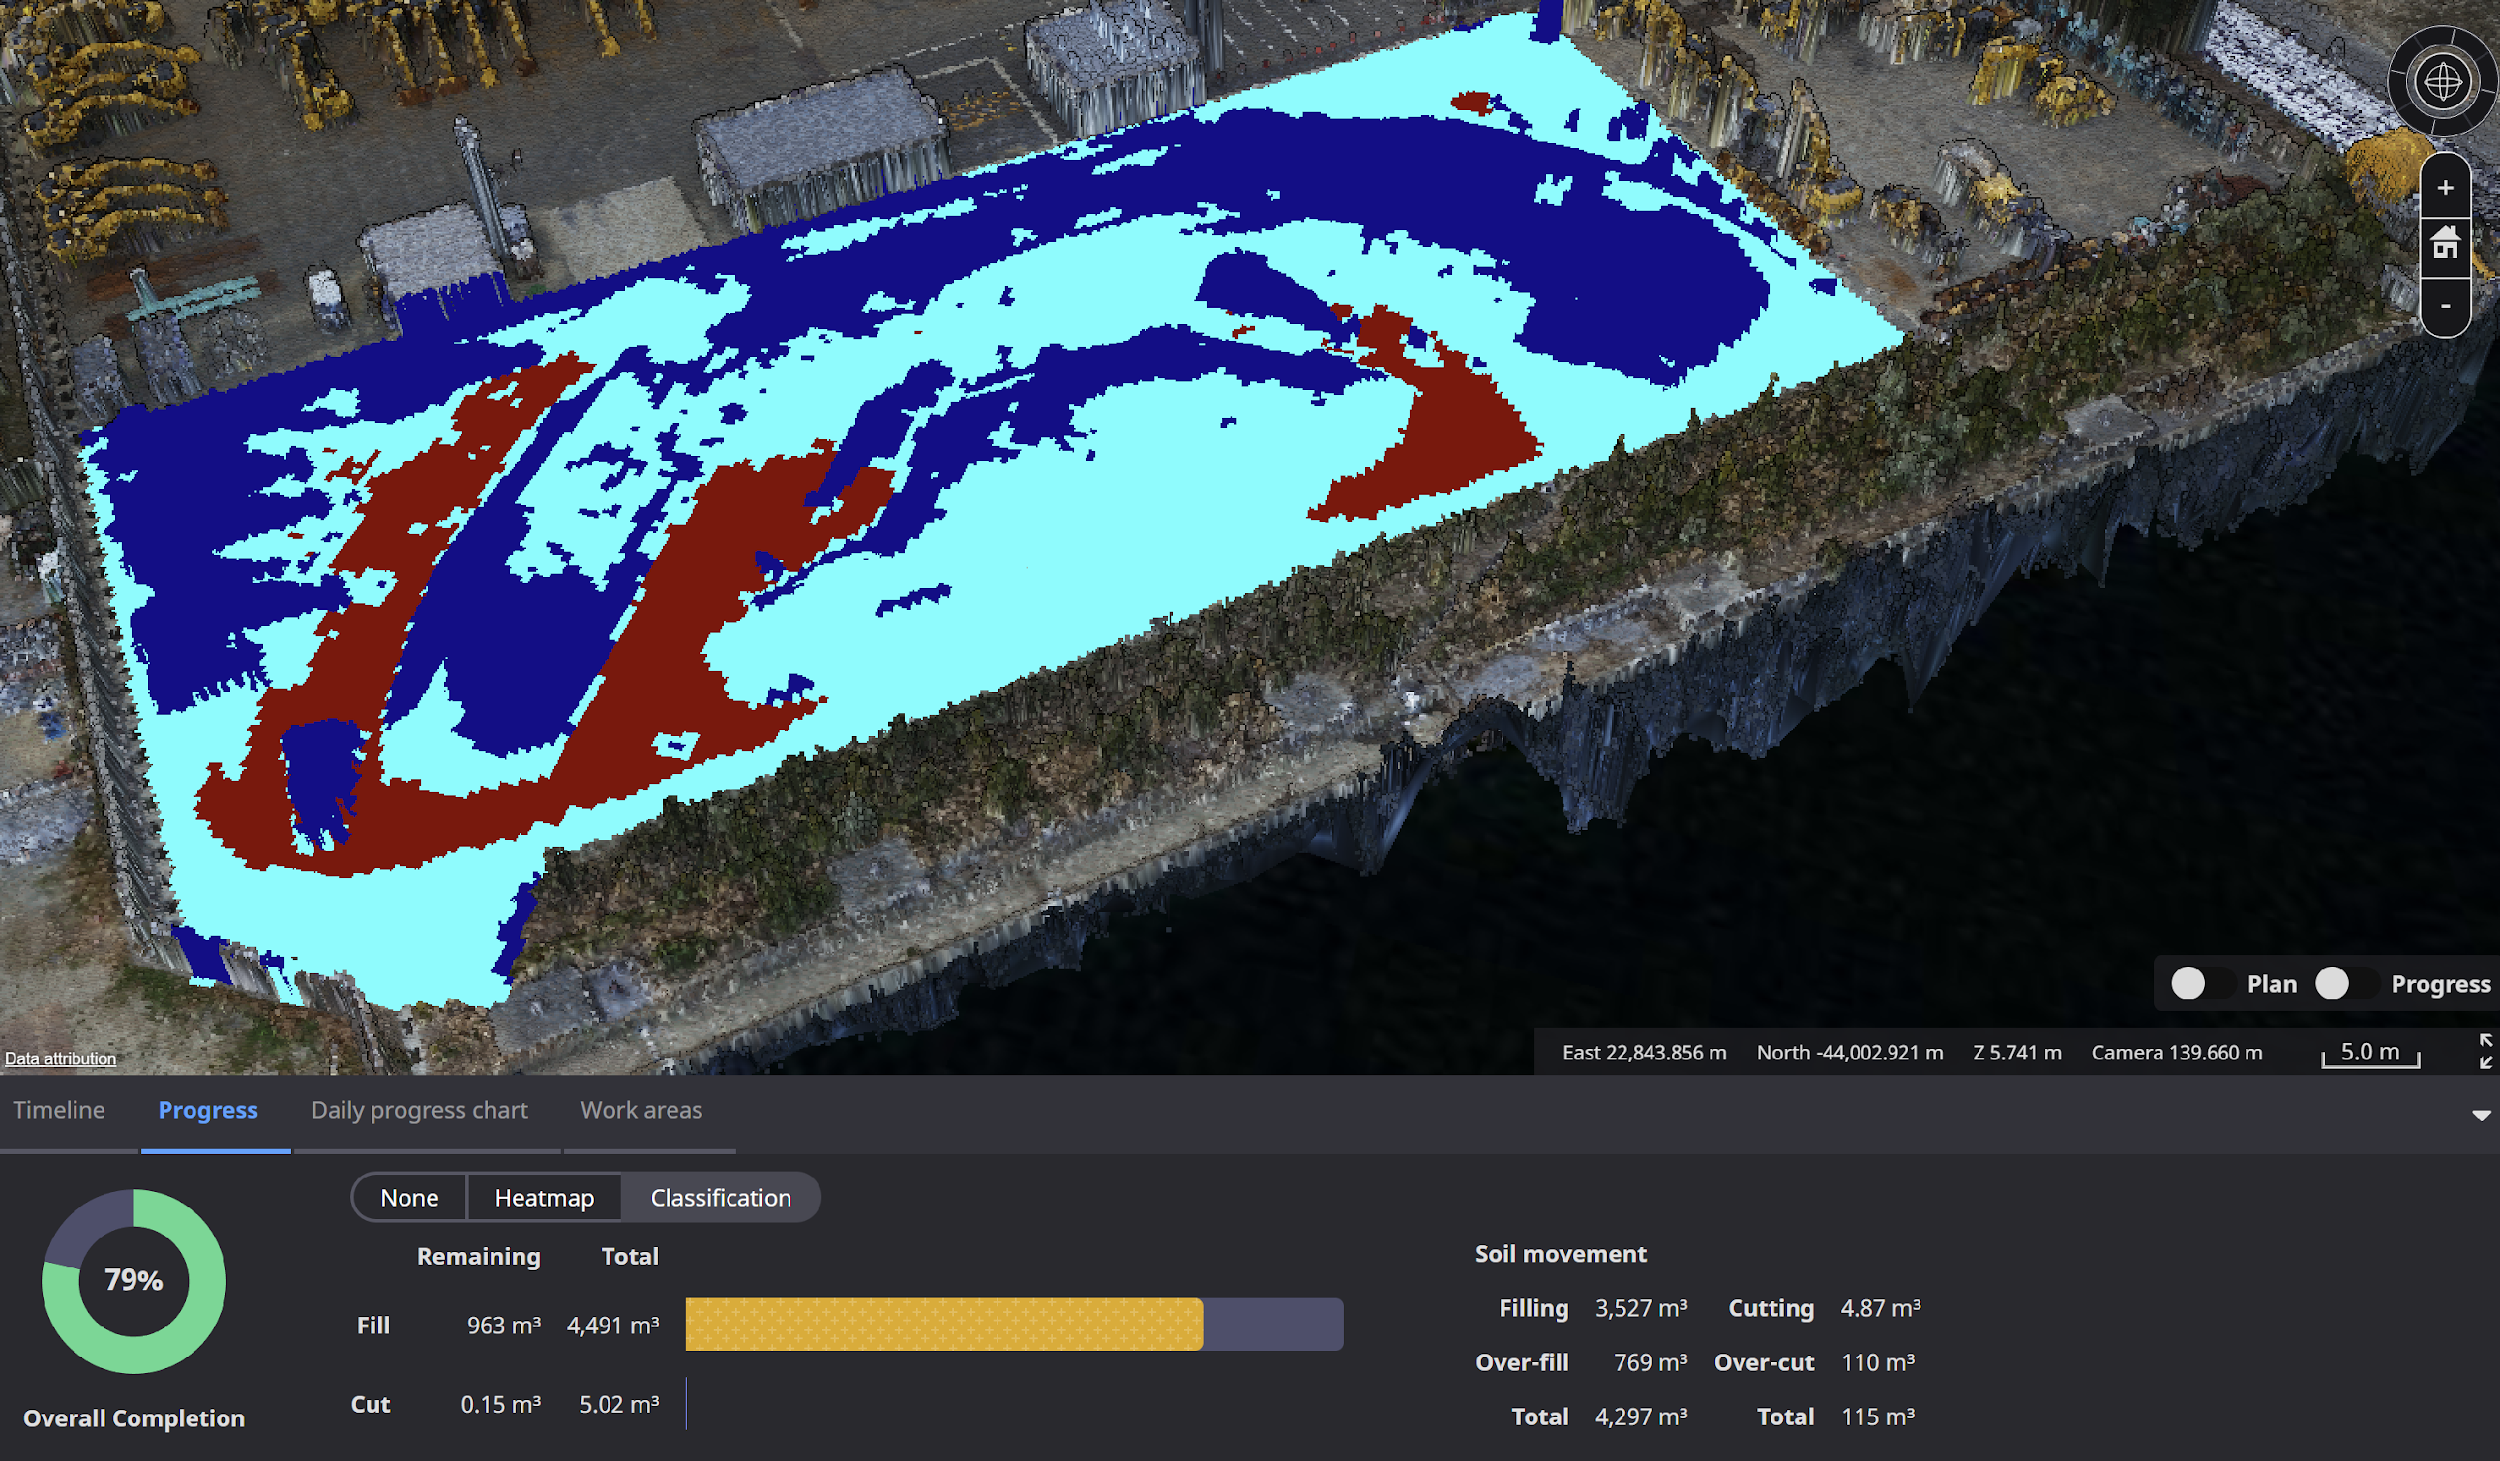
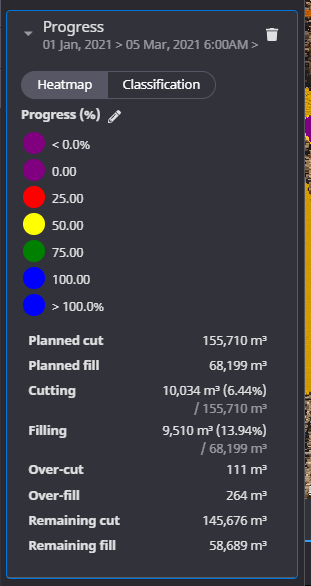
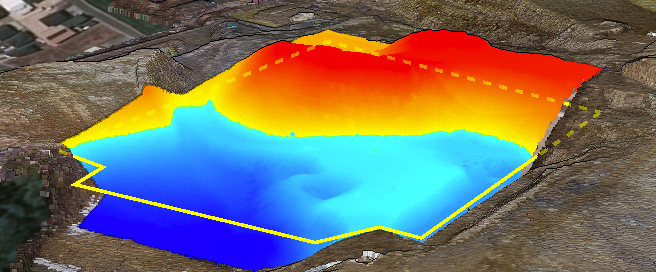
Heatmap & classification widget
The progress tab in the bottom panel has a None / Heatmap / Classification option to show progress as a sitewide measurement in the 3D view. The Heatmap option shows site progress (%). Colors are set to the default progress calculation colors – the same colors show on the 3D view as if the user created a site layer progress measurement.
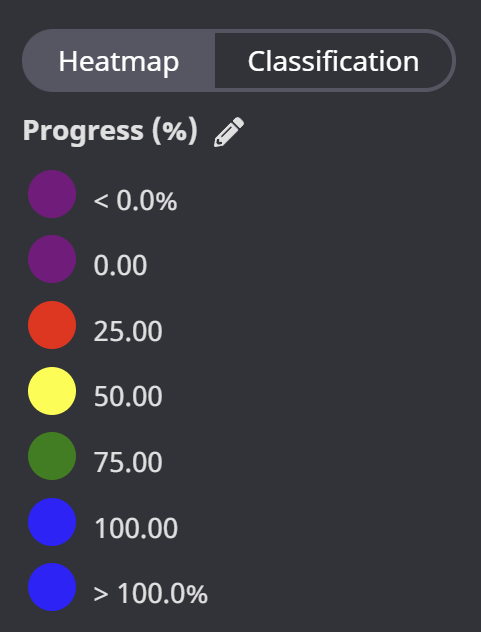
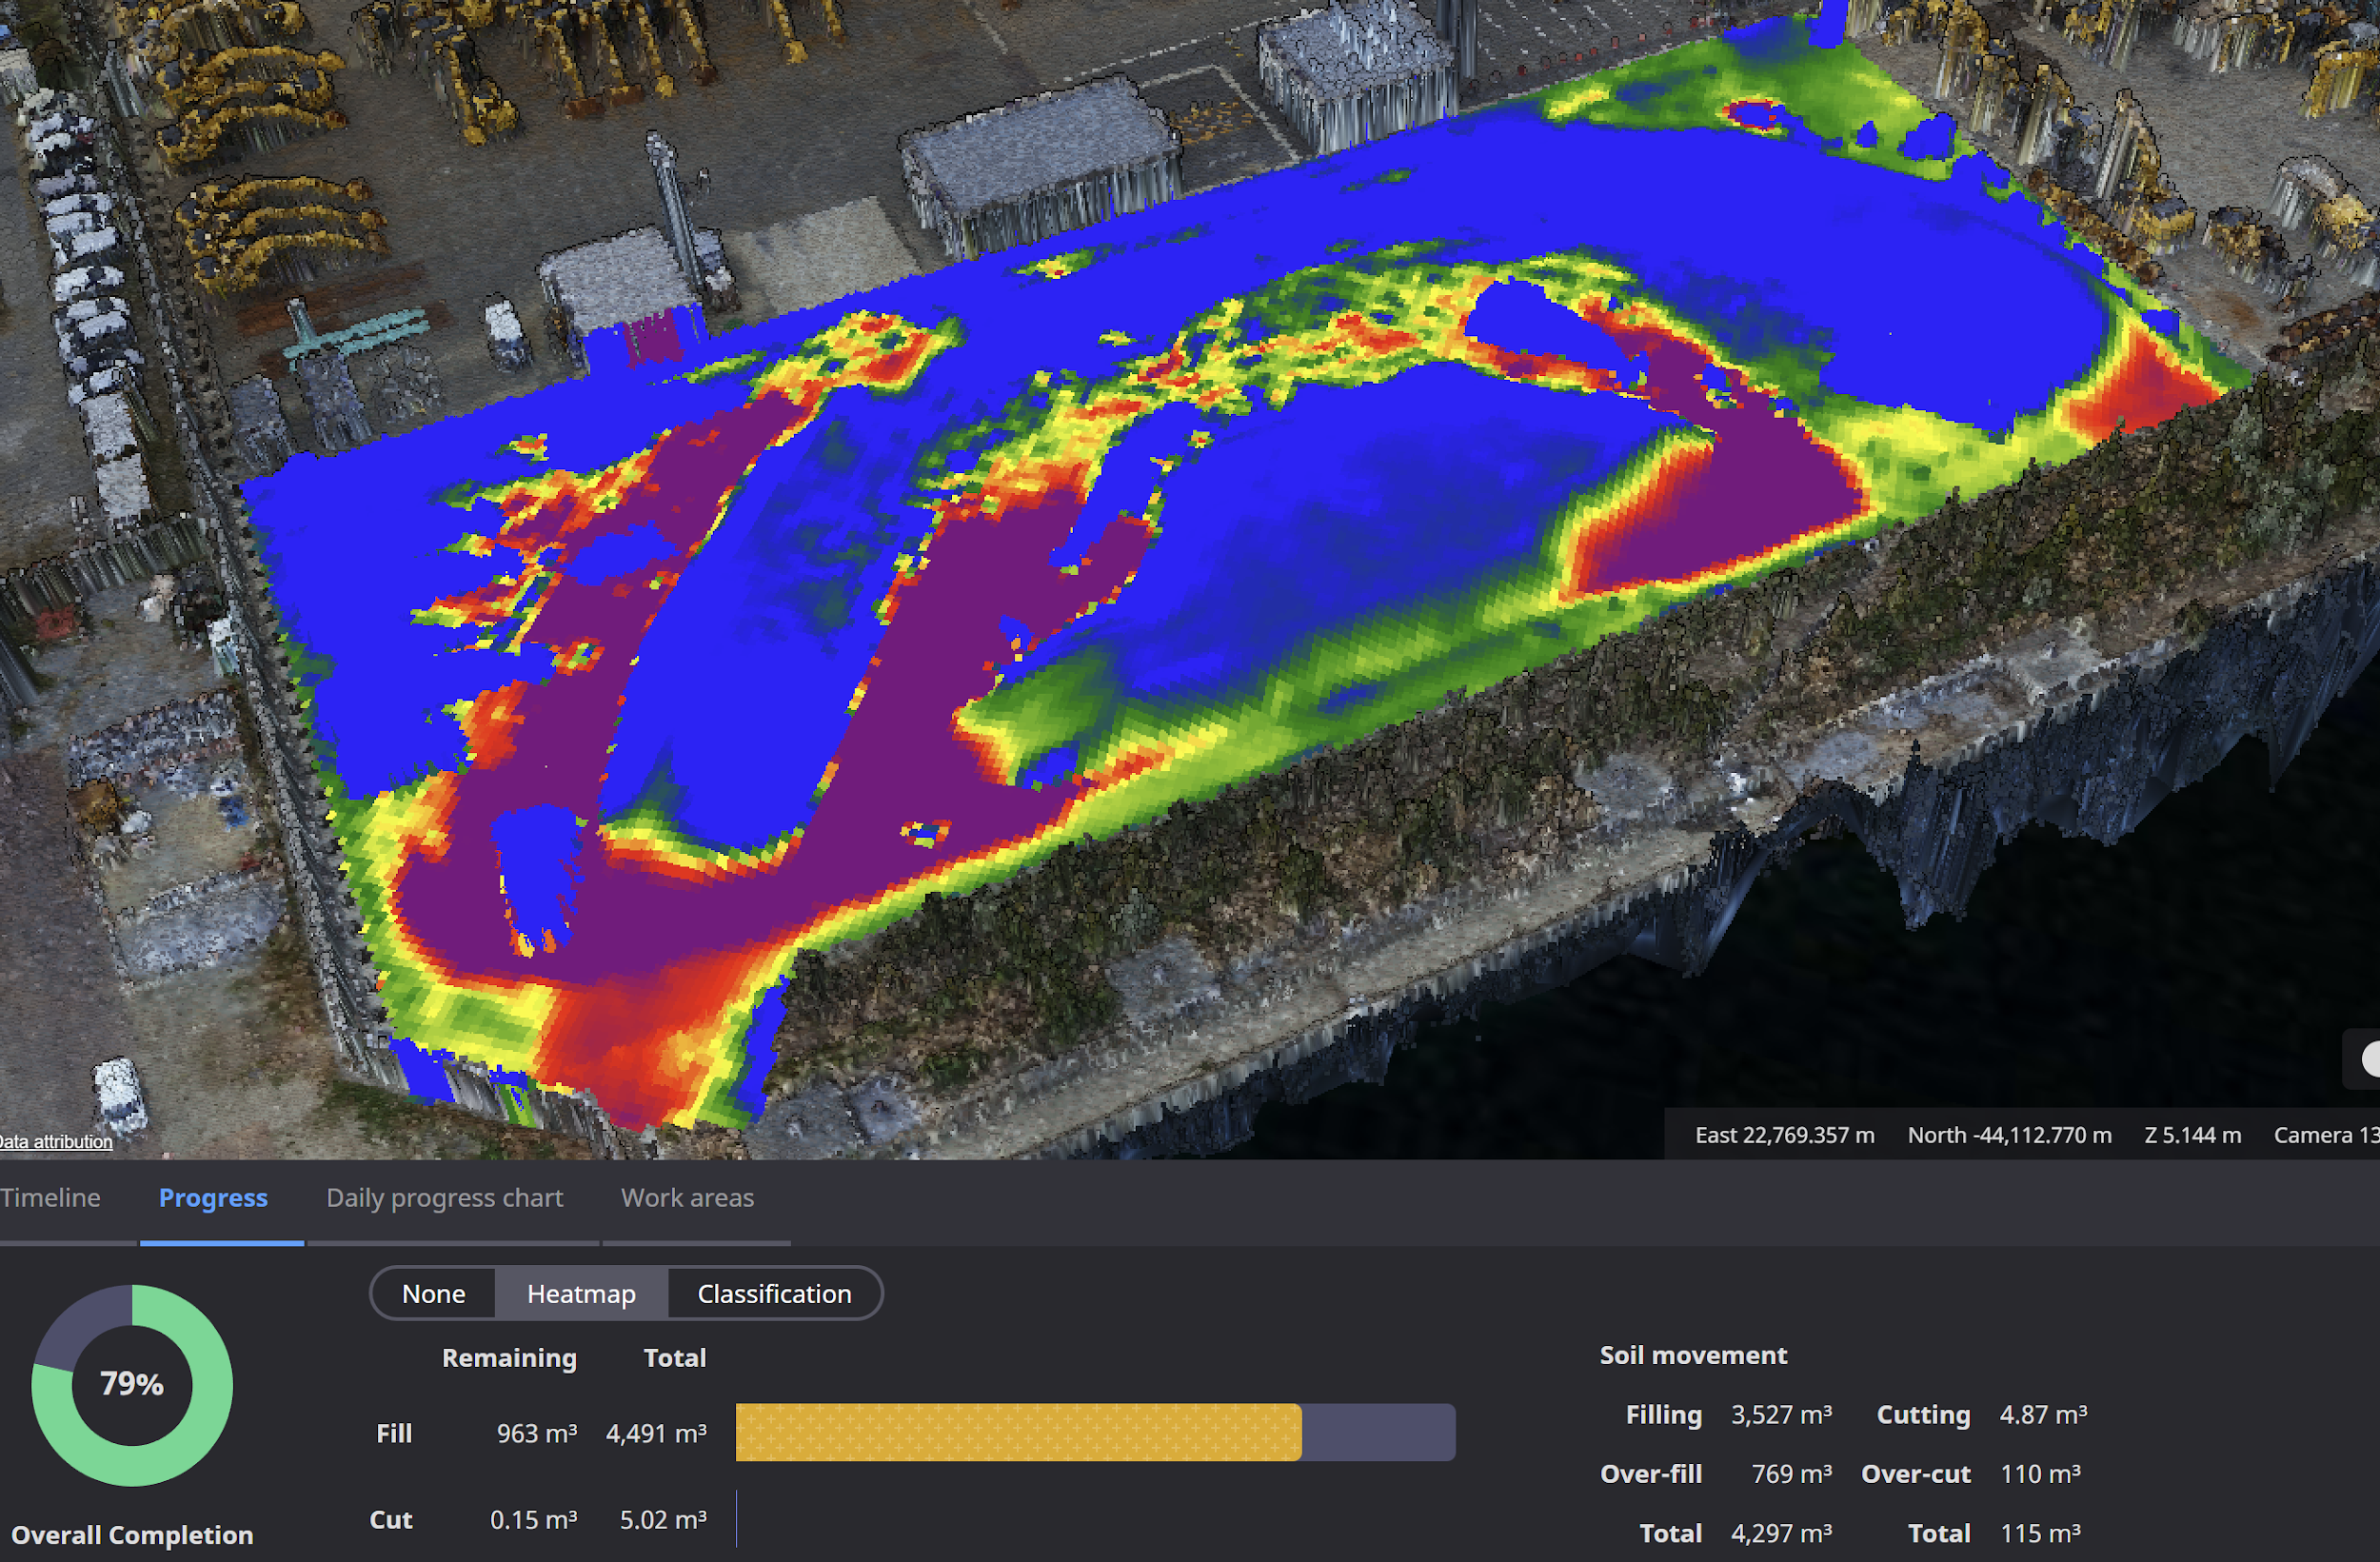
The Classification option also shows site progress but uses the classification method seen below.
Add data to your project
Data from the jobsite as well as design data can be displayed on the jobsite. Data or designs are added to the project as data layers. There are several types of data layers: time-tagged collected datasets, including Orthos, Surveys, and As Built data; and static datasets, including Design Surface, Design Linework, and Vector overlays.
To add data, you can upload a file from your computer, import survey data from drone services, or import external applications (where available).
Some datasets require a dataset capture time. Use a time on or around when the dataset was collected on the jobsite. When the dataset is displayed in Smart Construction Dashboard, it will show the data available at the selected time.
Uploading data
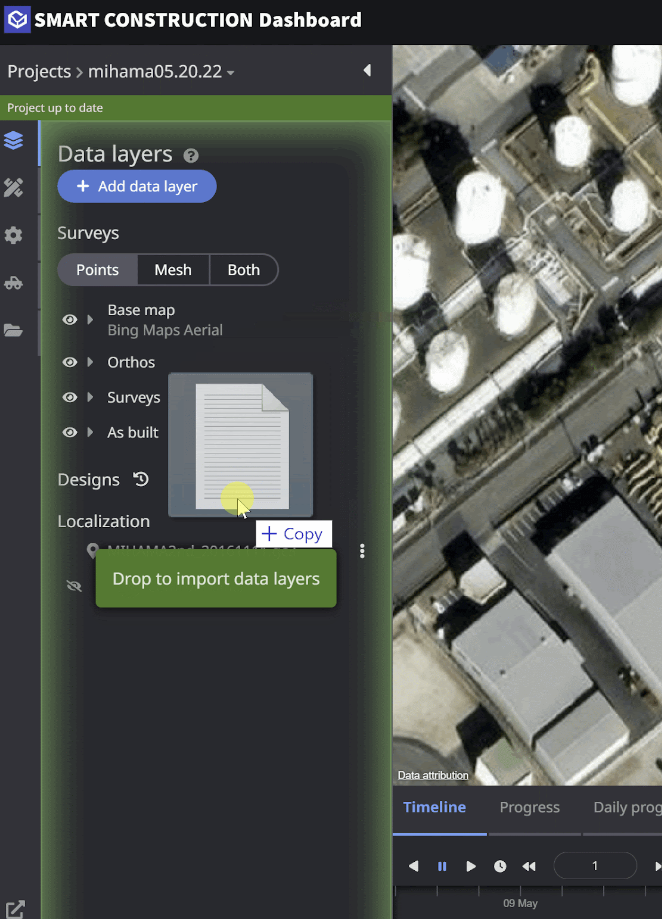
To upload data, open the Data Layers pane, click +Add data layer or Drag and drop your file into the left side panel. Dashboard will auto detect the file type and display the import options based on the file type.
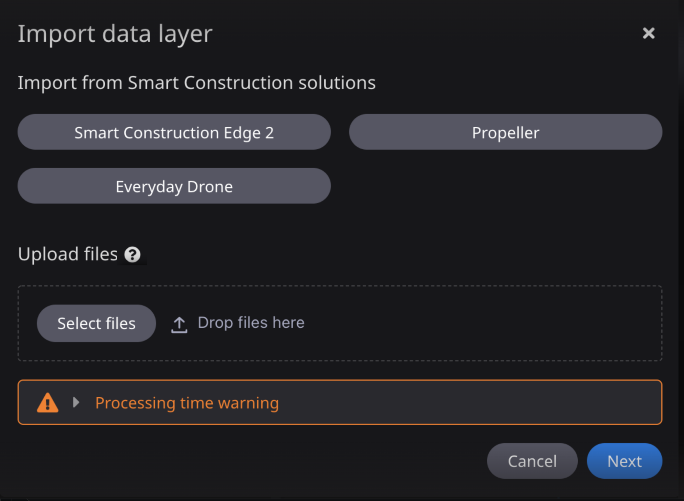
Import Data source
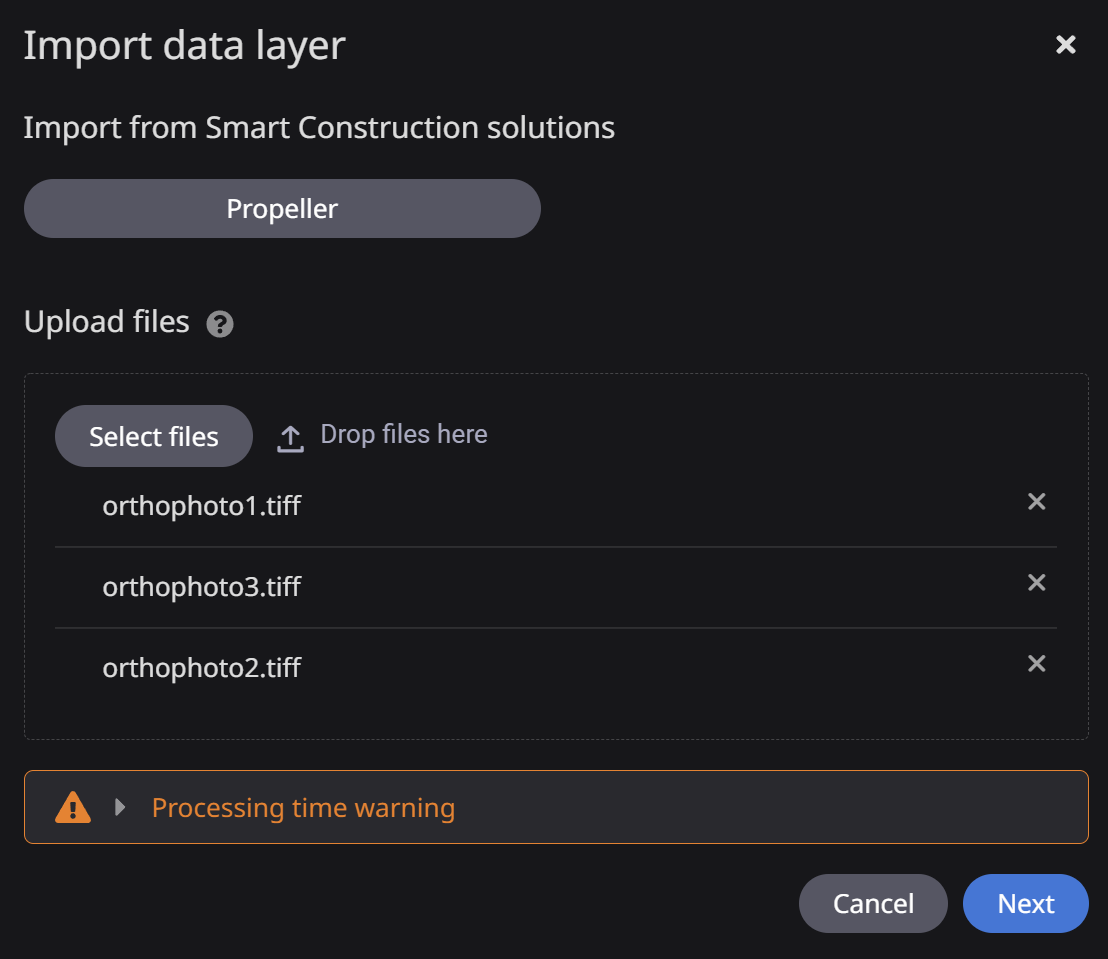
Upload files – Allows you to upload files directly to the Dashboard project. Everyday Drone – Allows you to import data from Smart Construction Drone. See for detail. Smart Construction Edge 2 – Allows you to import SC Edge drone data. see for detail. Propeller – Allows you to import survey data from existing Propeller projects. See for detail. To navigate to your local device folders, click Select files or drag and drop files into the upload box.
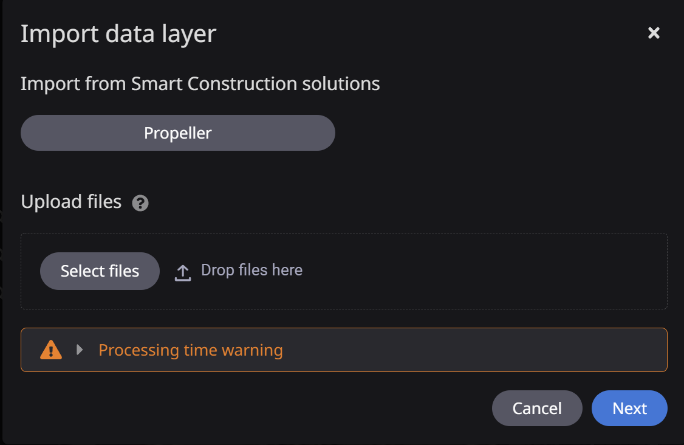
Available import source by region
Depending on the region of the user, certain upload options will be available / hidden. Japan region will display: - Everyday Drone - Smart Construction Edge 2 North America will display: - Propeller Europe will display: - Everyday Drone - Smart Construction Edge 2 Australia will display: - Everyday Drone - Smart Construction Edge 2
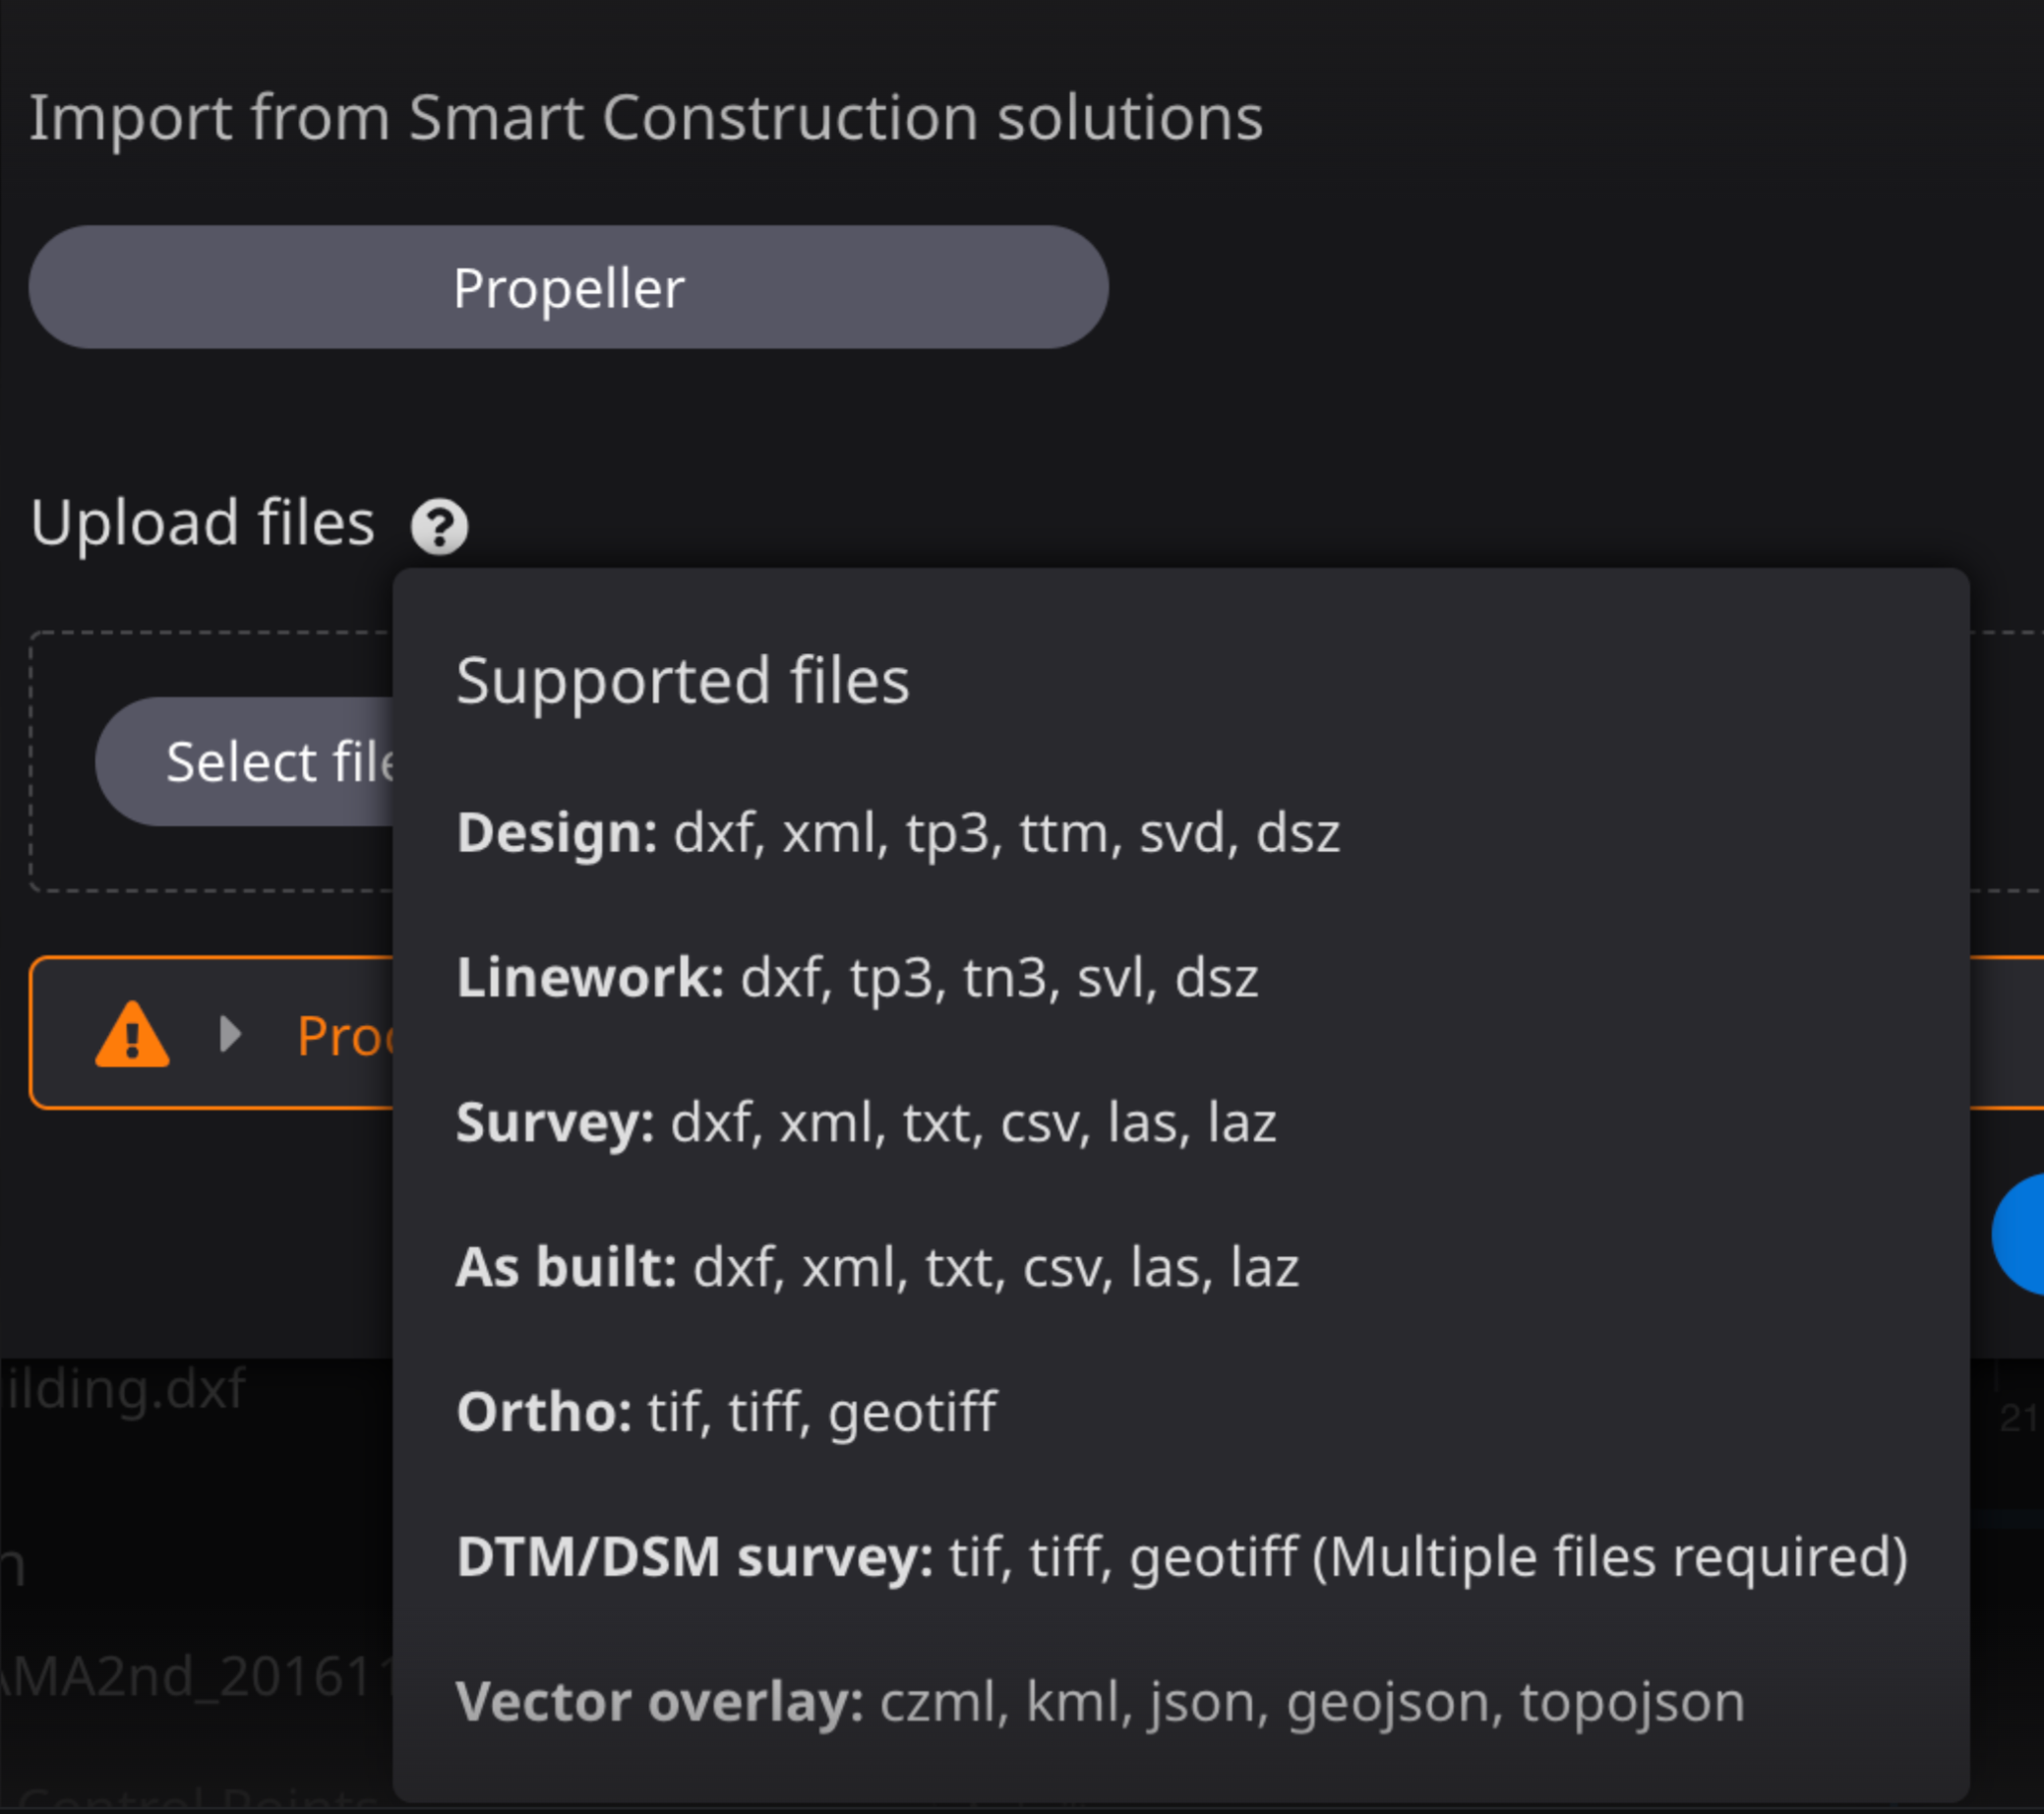
Clicking the question mark tooltip next to Upload files will display the supported file types. Depending on the file type selected by the user, import options specific to that file type will appear.
Import as Design or Linework
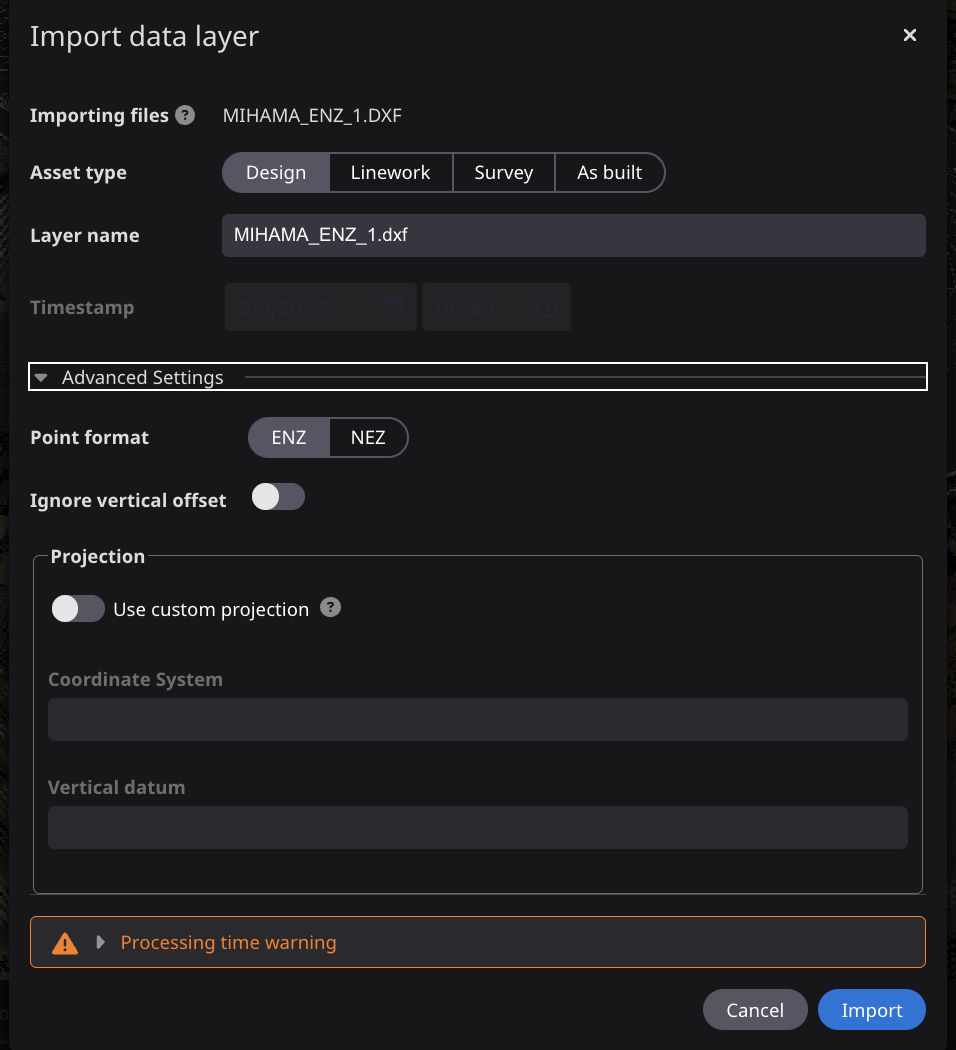
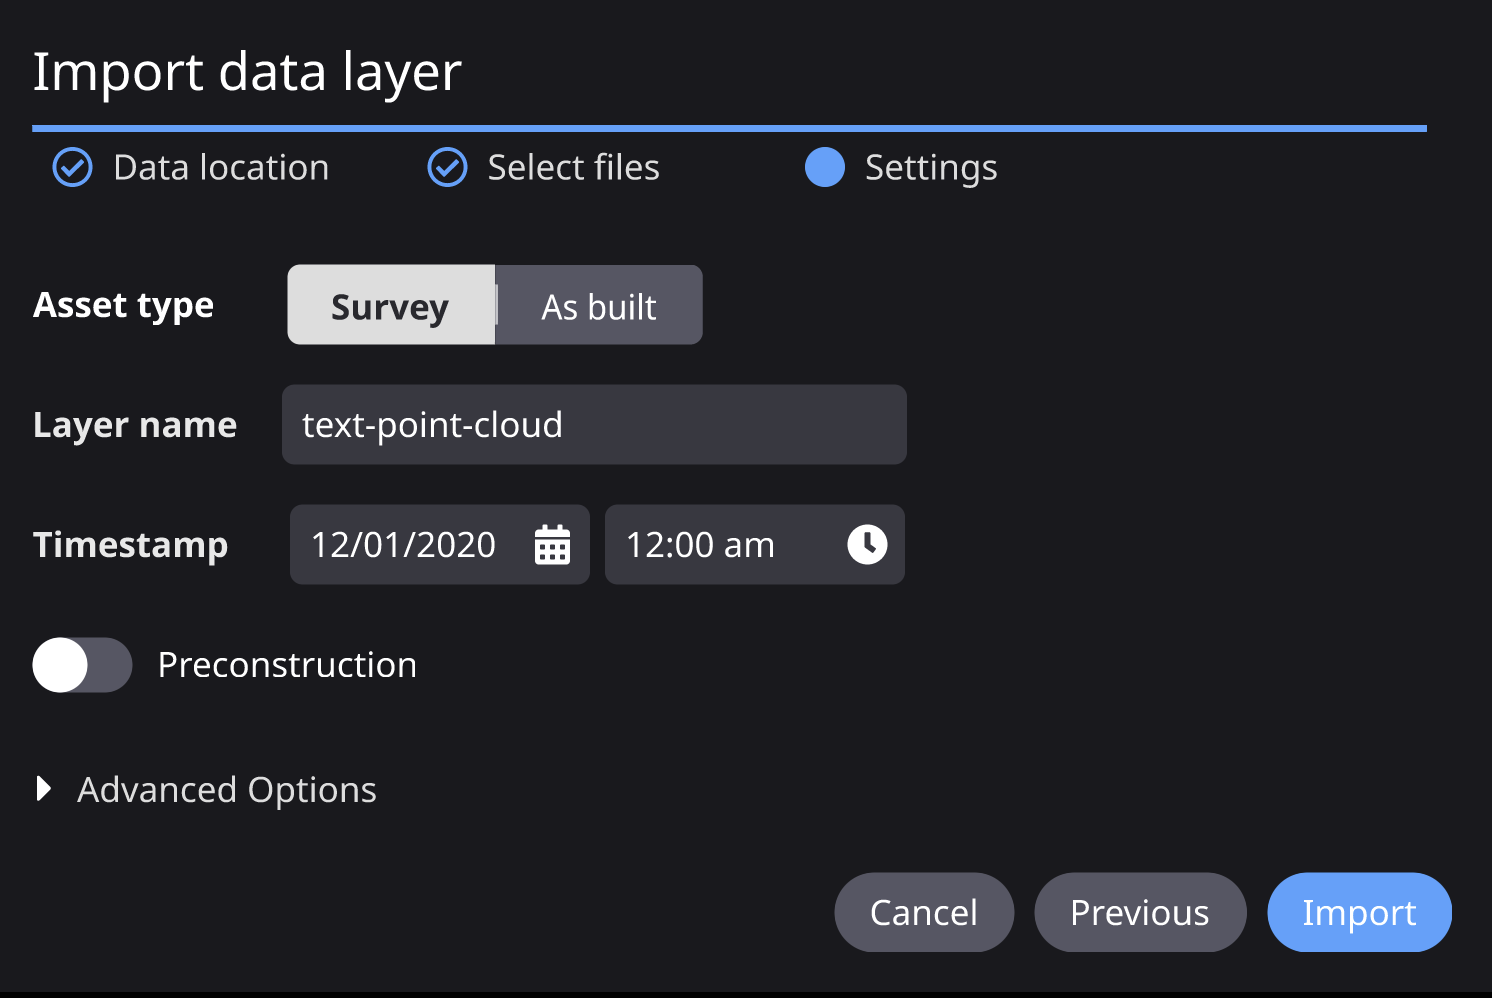
To import Design or Linework files, select one of the accepted file types and choose the desired asset type. Timestamp and Preconstruction options will not be available when uploading as Design or Linework. For DXF, advanced settings include Point format (ENZ or NEZ) and Ignore vertical offset, which is an option to use the site vertical datum instead of an embedded projection within the file.
User can also specify Diffrent Coordinate system if file CRS is wrong or missing.
Use Custom Projection - User can choose a coordinate system to use in place of the default. If an asset contains an embedded coordinate system, it is used as the default. Otherwise, the site coordinate system is used as the default.
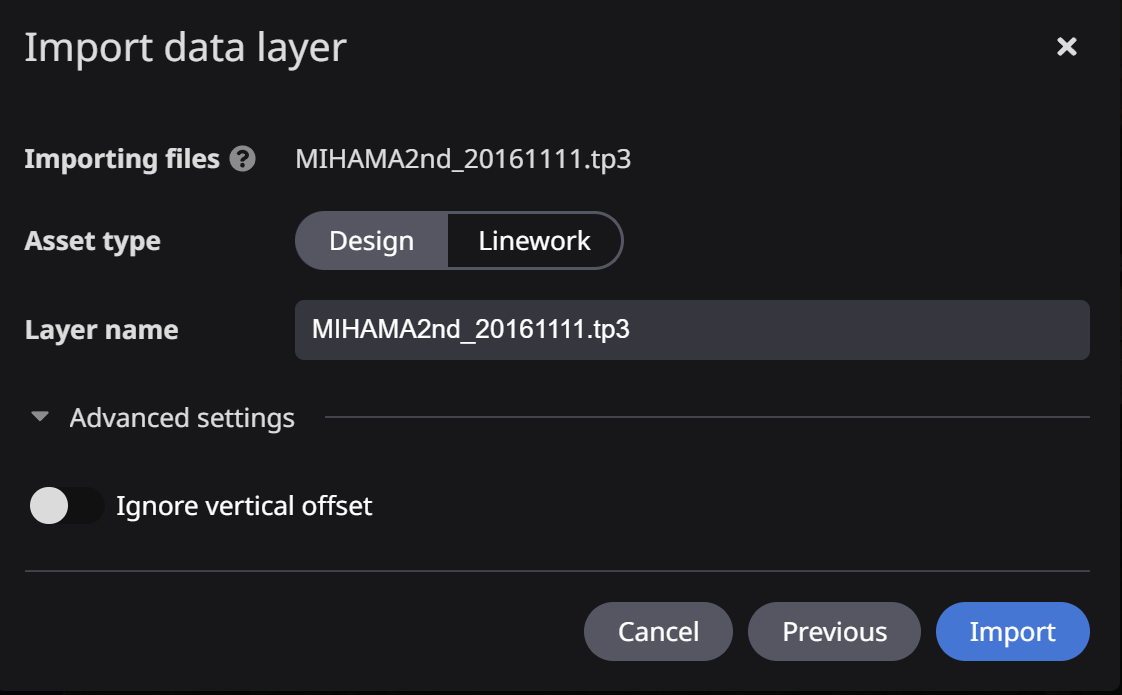
For TP3, the advanced settings will only include Ignore vertical offset.
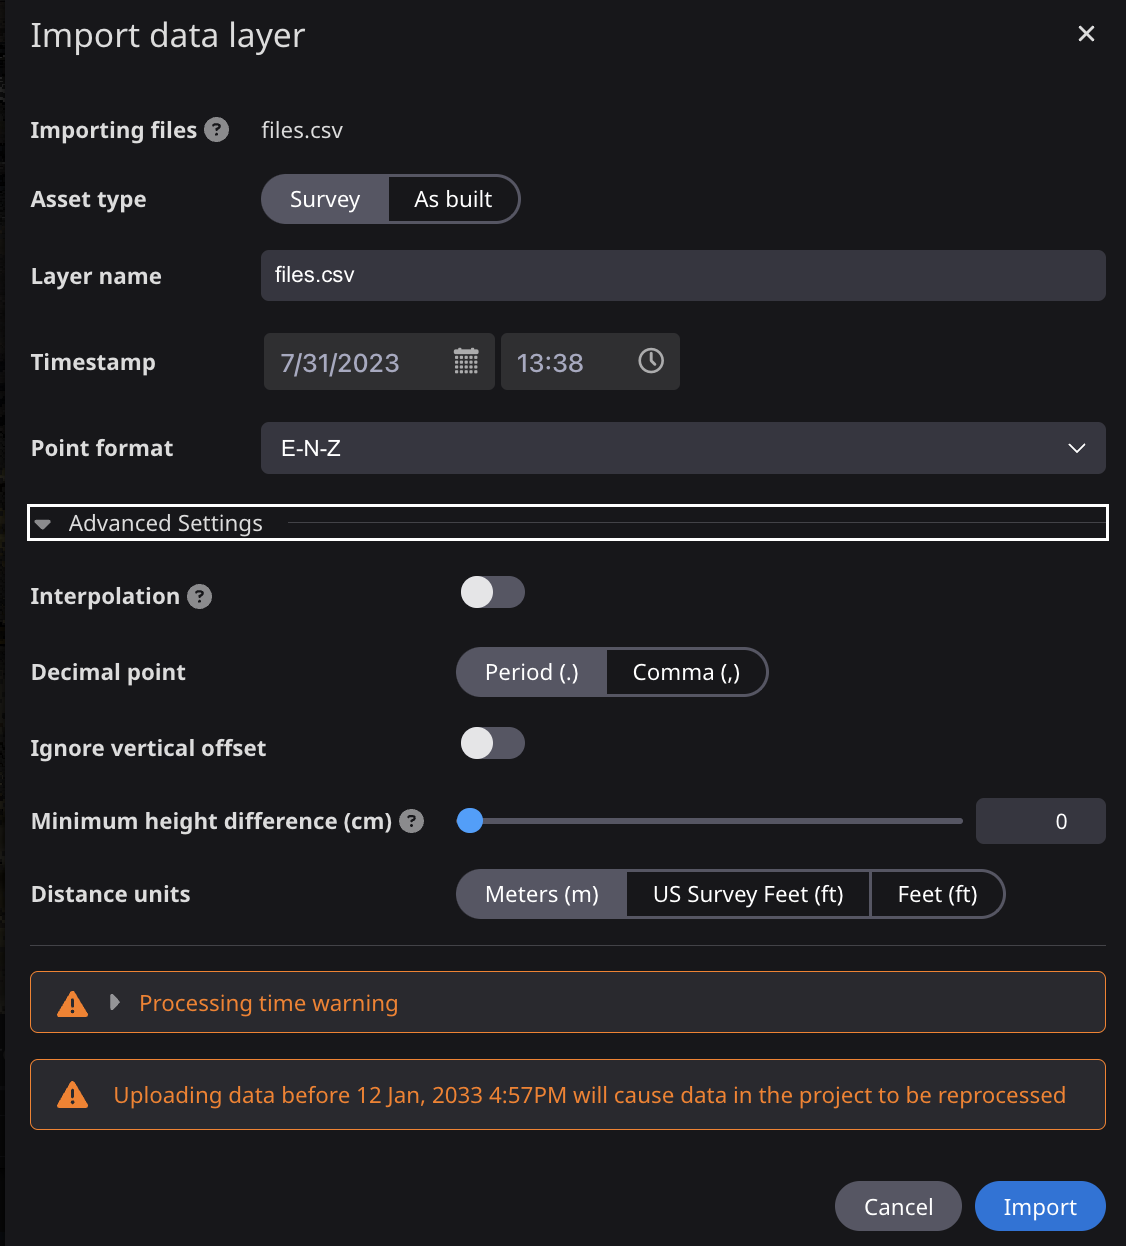
Import as Survey or As Built
To import a Survey or As Built file, select one of the accepted file types and choose the desired asset type. If survey is selected, the user has the option to set as a Preconstruction survey. Once the site has 1 pre-con survey, this option will no longer be available. If the site pre-con survey is deleted, the option will become available again.
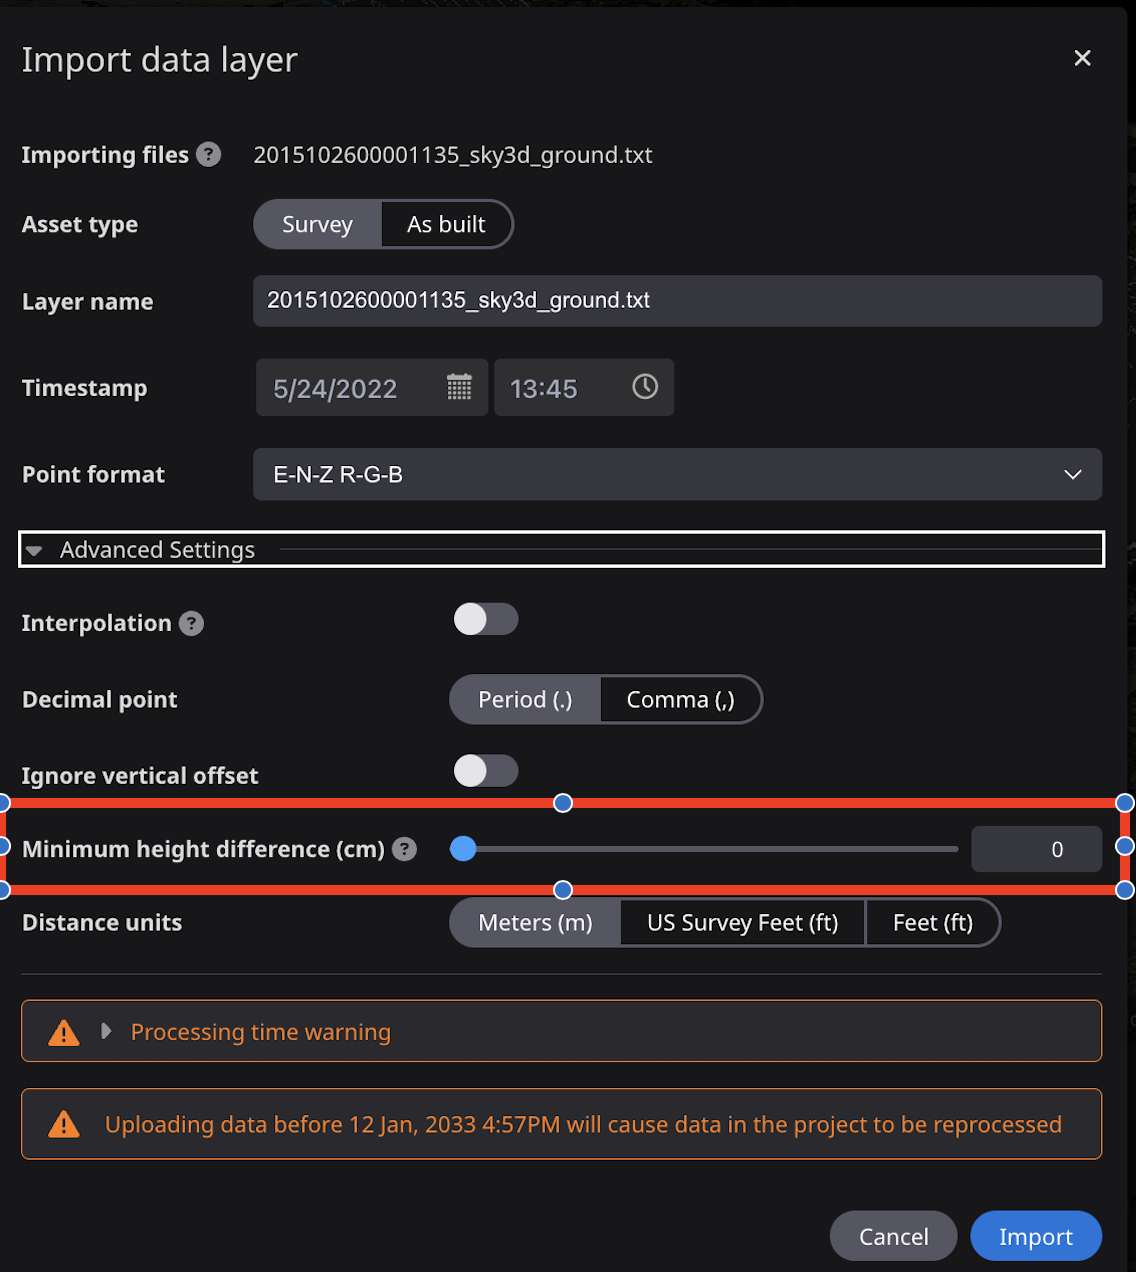
When importing CSV point cloud file, file’s unit can be specified in Adnvanced Settings. As default, file is read with assuming file’s unit as project’s ditance unit. But in some case, Point cloud file may be created with other distance unit like US feet. In that case user can change the Distance
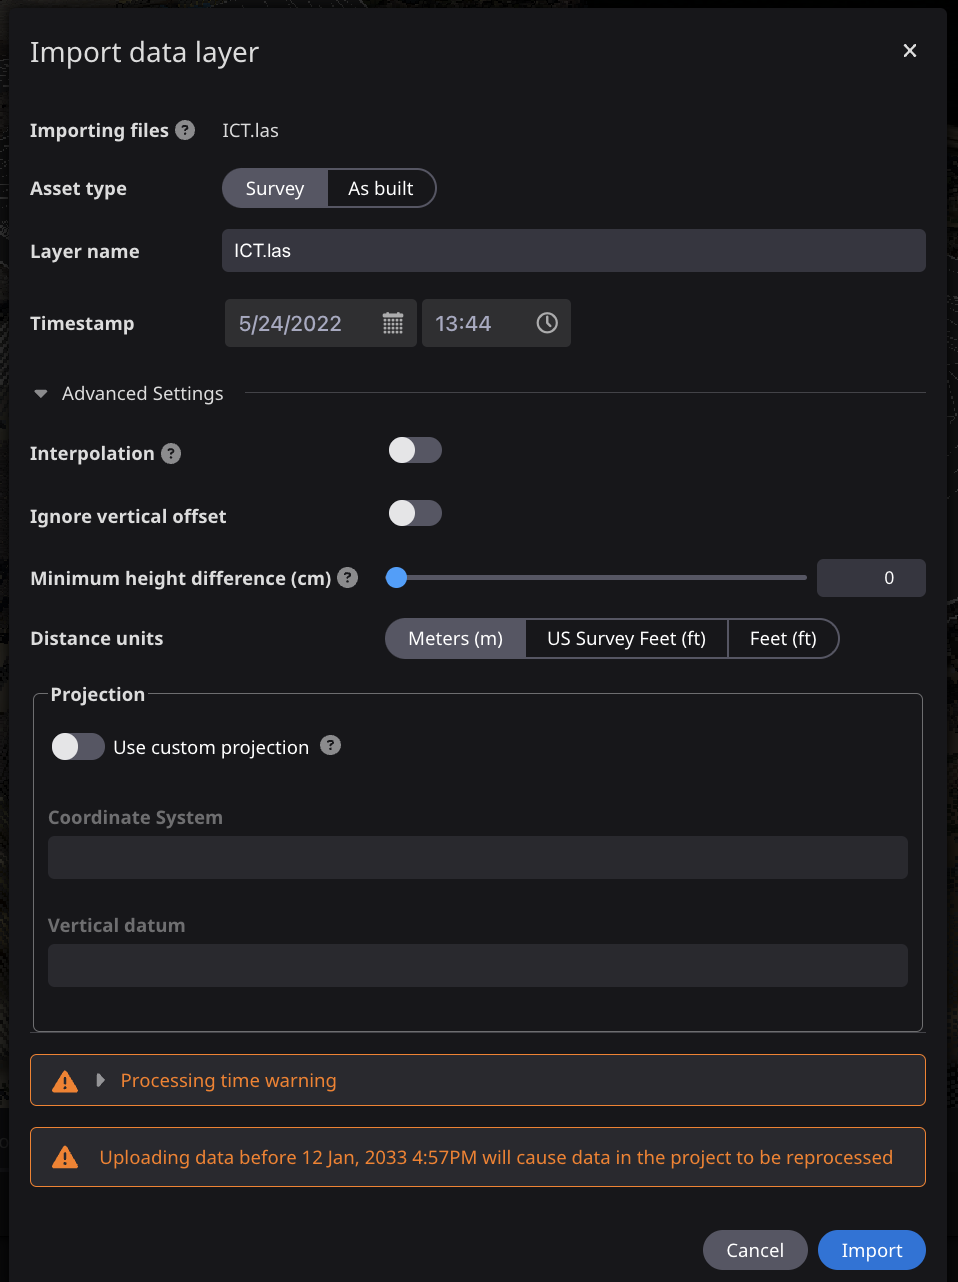
When importing LAS point cloud file, file’s Coordinate system informtion(CRS) can be specified in Advanced Settings.
Use Custom Projection - User can choose a coordinate system to use in place of the default. If an asset contains an embedded coordinate system, it is used as the default. Otherwise, the site coordinate system is used as the default.
Import as Ortho
To import an Orthoimage, select a tiff file. The only available asset type when uploading 1 tiff file will be Ortho.
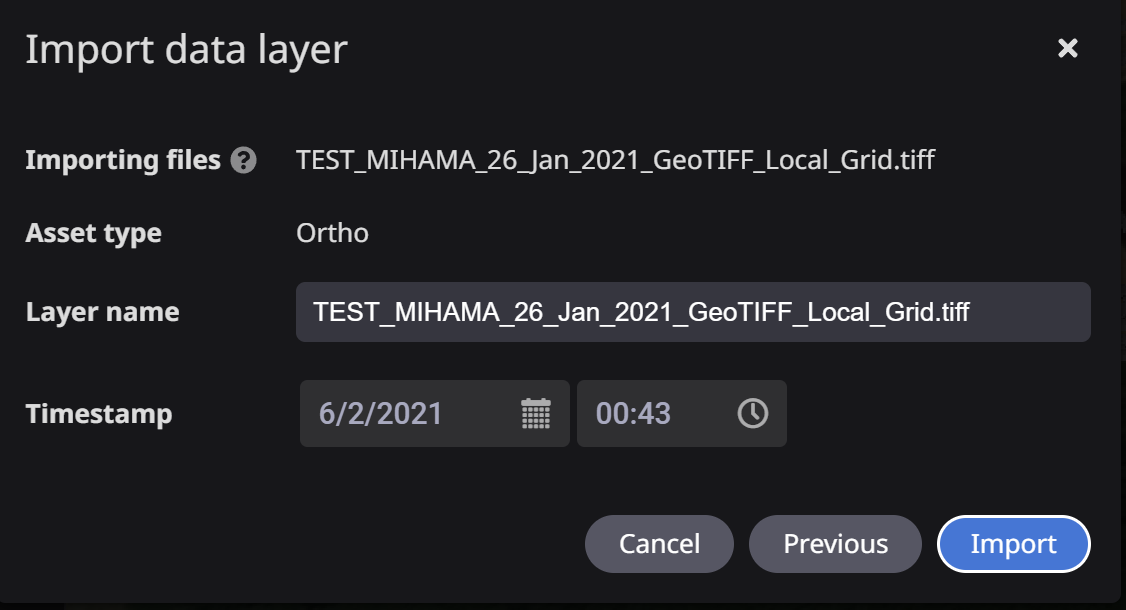
The user also has the option to upload multiple ortho files to be merged.
Import as DTM/DSM Survey
When multiple tiff files are selected, the option for DTM/DSM survey will appear. To upload merged orthoimagery, use the Ortho asset type. The layer name and date are editable.
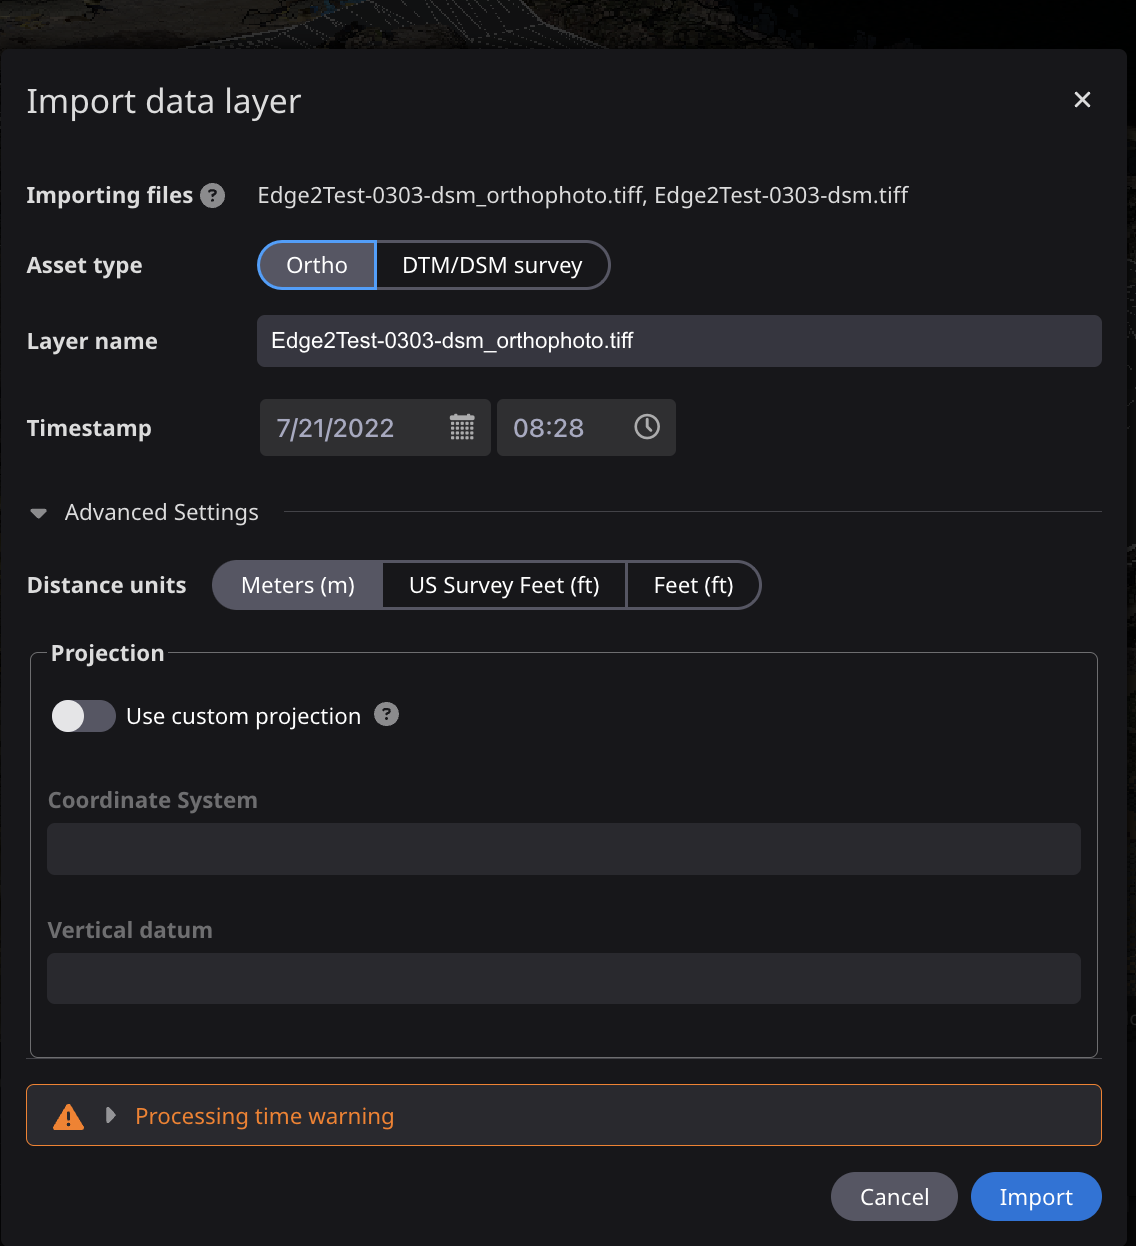
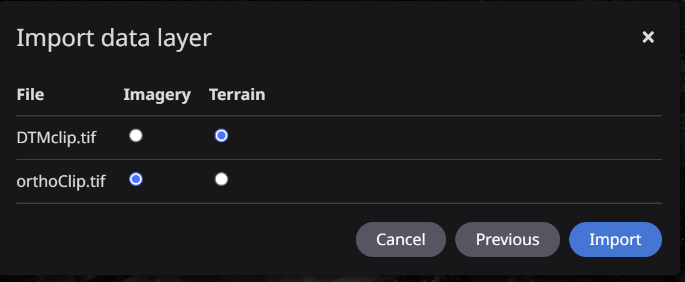
To import a DTM/DSM survey, the user must select multiple files to upload - an orthoimage and DTM file pair. Set the asset type to DTM/DSM survey. Preconstruction option and advanced settings will become available. Height Reference – Dashboard will auto detect this vertical datum, but the user can also manually choose.
Choose which file will be classified as Imagery and which will be Terrain. Click Import.
Import as Vector overlay
When uploading a Vector overlay file, no advanced options will be available. Edit the layer name if necessary and click Import.

Adjust error tolerance To account for small differences in data collection, volume measurements can ignore a small height difference when comparing surfaces. When importing or uploading data, adjust the Minimum height difference slider to the maximum height difference between compared surfaces. Minimum height difference allows you to set a threshold to reduce the impact of fluctuations in a point cloud when performing measurements.
File types
| Data layer type | Accepted file types | Notes |
| Orthos Ortho images are 2D images of the topology, which are layered over the base map | GeoTIFF (.tiff, .tif) | The file must be georeferenced. All GeoTIFF files are processed using the units as defined by the file. |
| Point cloud surveys Topology data collected over a large area from drones which allow you to make measurements against the features in the uploaded file | LASer (.las, .laz) CSV (.txt, .csv), LandXML (.xml) | All LASer files are processed using the units as defined by the file. Georeferenced LASer files are processed using the coordinate system as defined by the file. Otherwise the coordinate system specified in the project is used. CSV files are always processed using the coordinate system and units specified in the project (meters, international feet, or US survey feet). |
| Preconstruction survey The dataset representing the initial terrain | LASer (.las, .laz) CSV (.txt, .csv) LandXML (.xml), DXF (.dxf) | If a target design surface is registered to the project, any missing areas of the survey will be interpolated with the target design surface to produce more accurate progress measurements. All LASer files are processed using the units as defined by the file. Georeferenced LASer files are processed using the coordinate system as defined by the file. Otherwise, the coordinate system specified in the project is used. CSV files are always processed using the coordinate system and units specified in the project (meters, international feet, or US survey feet. The units for LandXML and some DXF files are specified in the file itself. If units are not specified in the design file, the project’s units are used instead. Georeferenced DXF files are processed using the coordinate system as defined by the file. Otherwise, the coordinate system specified in the project is used. |
| As Built Higher-resolution topology data collected from machines active on the jobsite | CSV (.txt, .csv), DXF (.dxf), LandXML (.xml), LASer (.las, .laz) | CSV files are always processed using the coordinate system and units specified in the project (meters, international feet, or US survey feet). |
| Design surface Design surface files contain 3D mesh data that allow you to make measurements against the features in the uploaded file | DXF (.dxf) LandXML (.xml) Trimble (.ttm, .svd, .dsz) TOPCON (.tp3, .tn3) | The units for LandXML and some DXF files are specified in the file itself. If units are not specified in the file, the units specified in the project (meters, international feet, or US survey feet) are used. Georeferenced DXF files are processed using the coordinate system as defined by the file. Otherwise the coordinate system specified in the project is used. |
| Design linework Vector design data such as alignments, centerlines, stations, or other features that can be overlayed over the jobsite | DXF (.dxf) LandXML (.xml) Trimble (.svl, .dsv) TOPCON (.tp3) | The units for LandXML and some DXF files are specified in the file itself. If units are not specified in the design file the project’s units are used instead. Georeferenced DXF files are processed using the coordinate system as defined by the file. Otherwise the coordinate system specified in the project is used. A layer structure defined in the linework file will be preserved and displayed as sublayers of the design layer. Each sublayer can be toggled on or off individually and can specify a color. |
| Vector overlay Custom data containing points, lines, polygons, or other features that can be overlayed over the jobsite. | CZML (.czml) GeoJSON (.json, .geojson) KML (.kml, .kmz) | The file is always processed with a “EPSG 3875: WGS84 Spherical Mercator” (aka Web Mercator) projection, as defined by the file specifications. By default the data is displayed at the height of the WGS84 ellipsoid. By contrast, your project data is displayed at the height of the geoid defined by the project’s coordinate reference system. To match the layer to your site’s geoid, instead of the WGS84 ellipsoid, select the Clamp to ground option from the context menu in the data layers list. |
| Building Design Structured design data of Structure data like bridge. | IFC file(.ifc) | The IFC file contains the components like bridges or other structures in a layered format. It is possible to show or hide the parts arranged in each level of layers. |
Importing data
Ortho and Survey data layers can be imported from Drone services if your Smart Construction account has access to this service.
SC Edge 2
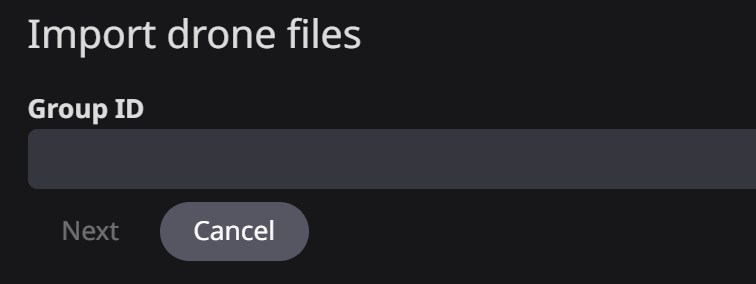
To import drone data from an Edge Box, open the Data Layers panel, click Add data layer, and choose Smart Construction Edge 2.

Specify the Group ID associated with the Edge Box.
Data available to your Smart Construction group will be displayed. Select the data to import and click Next.
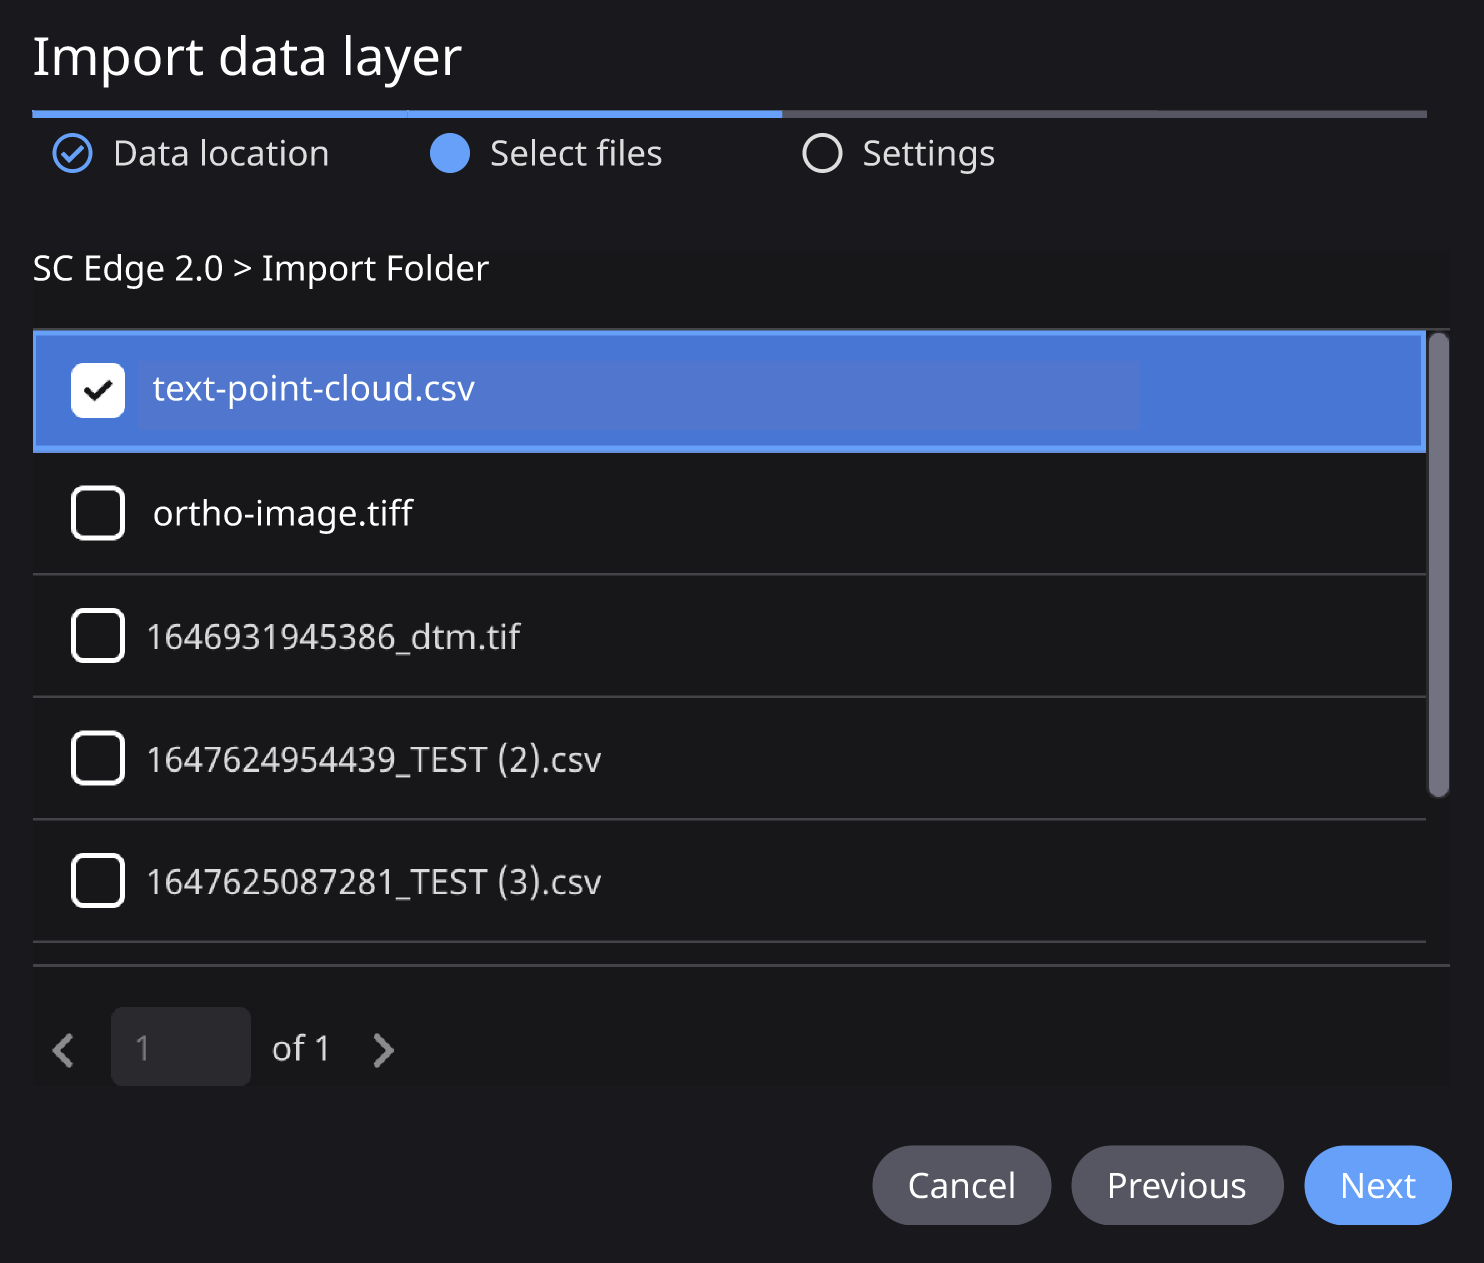
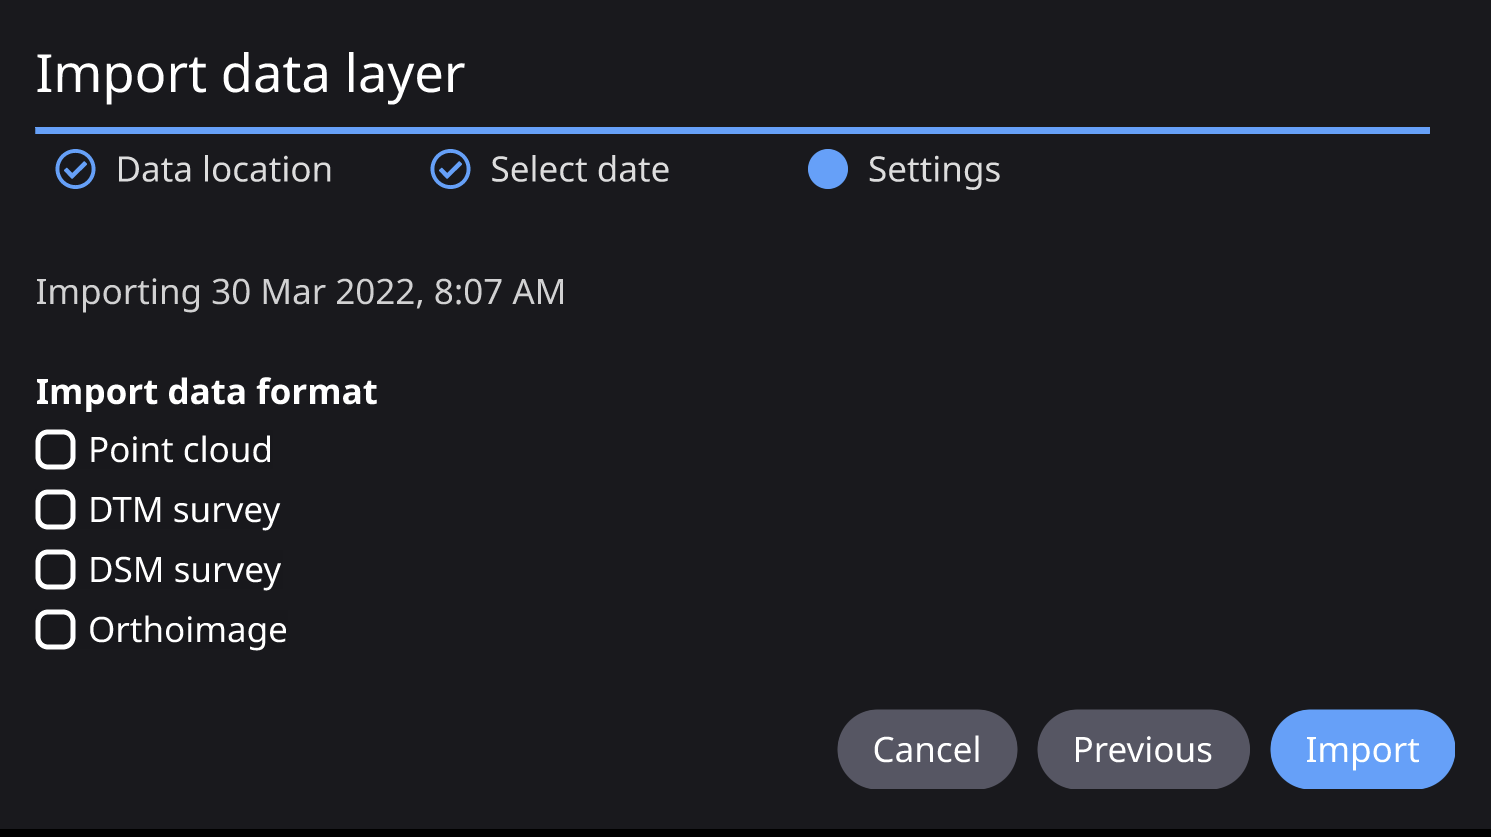
Based on the file type chosen, options will be available for the data to be imported.
Propeller
To import drone data from Propeller, open the Data Layers panel, click Add data layer, and choose Propeller.
Note: To import files, you must start by registering the site in the Propeller portal.

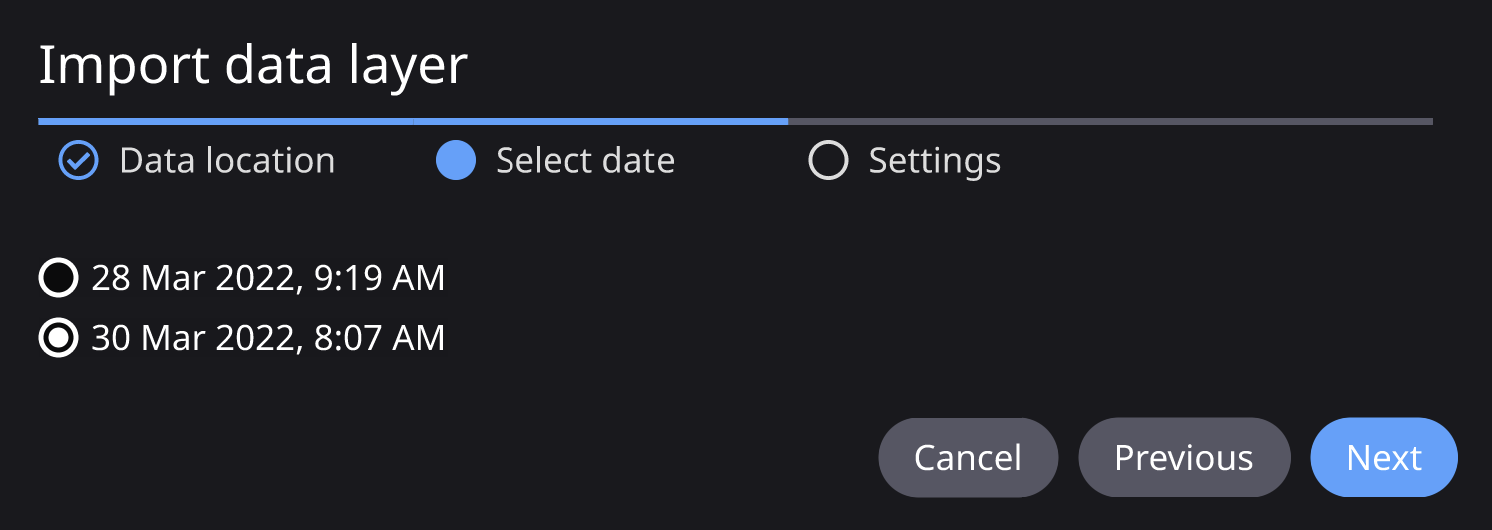
Data available to your Smart Construction group will be displayed. Select the date of the drone datasets to import

Select the dates of the datasets to import and click Import and add. The files will begin transferring and processing.
Everyday Drone
To import drone data from an Edge Box, open the Data Layers panel, click Add data layer, and choose Everyday Drone.

Specify the Group ID associated with the Drone data.

Data available to your Smart Construction group will be displayed. Select the date of the drone datasets to import and click Next.
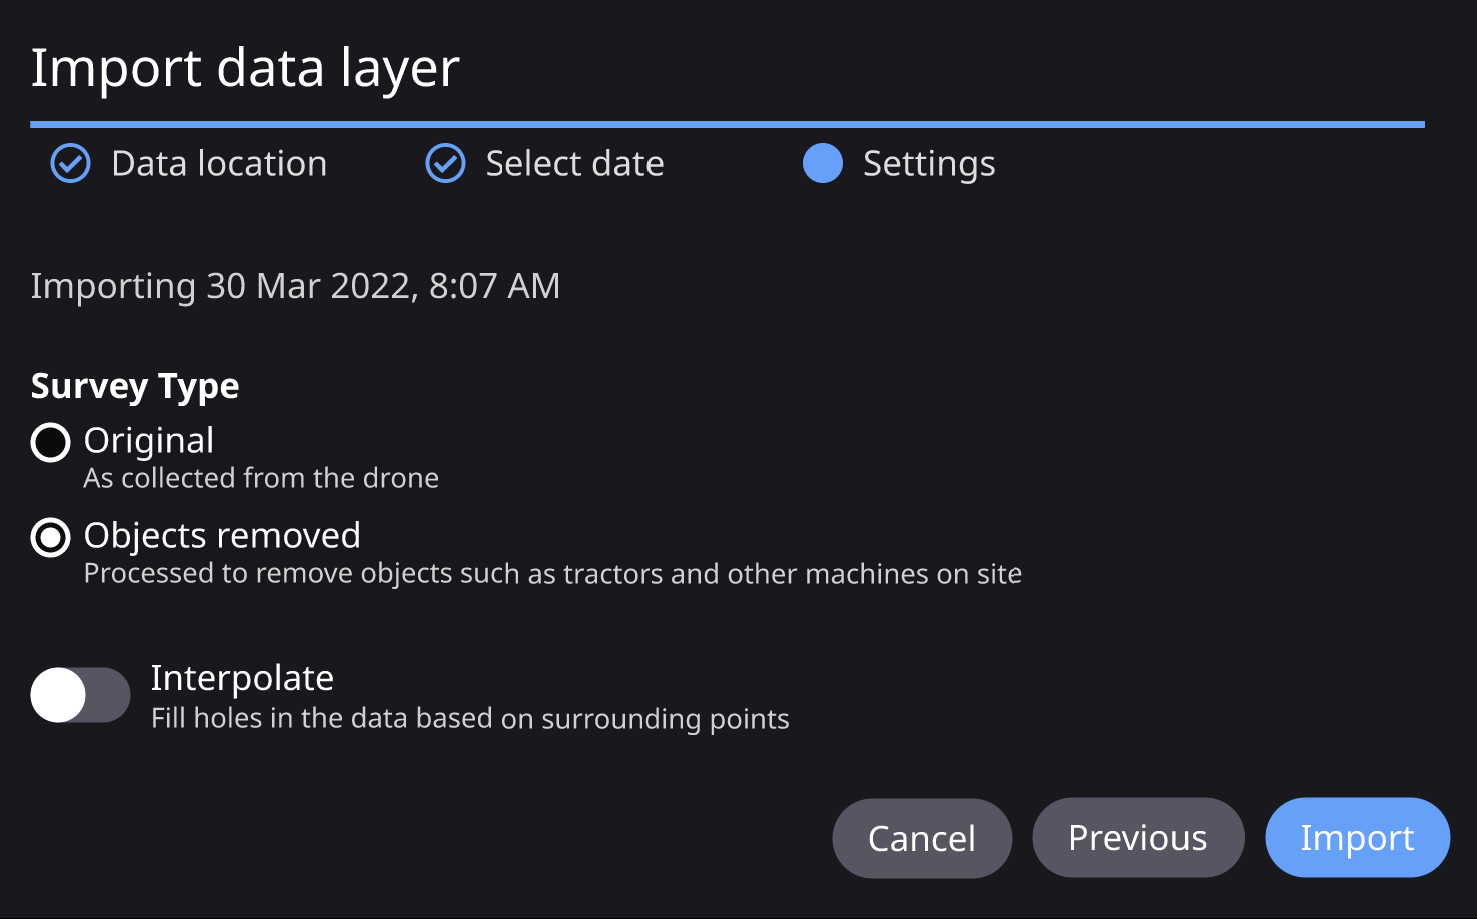
Select Survey Type - you may select to upload the data with Object removed or Original. The Interpolate option can be toggled on/off. This setting fills holes in the data based on surrounding points. Click Import. The files will begin transferring and processing.
Upload and tiling status reporting
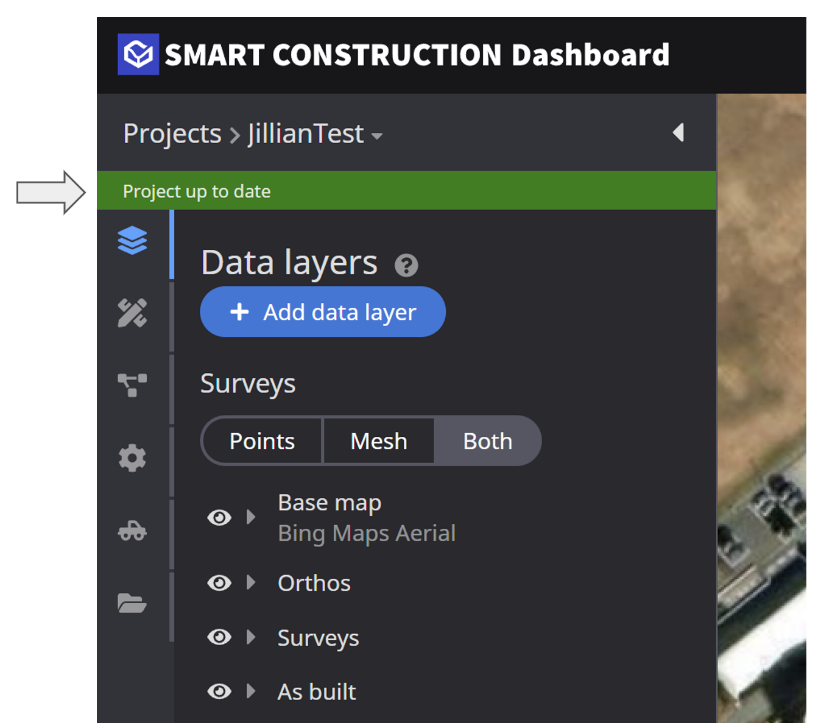
Project is up to date Site is healthy and up to date No files are currently being uploaded / processed / tiled No errors occur within the site
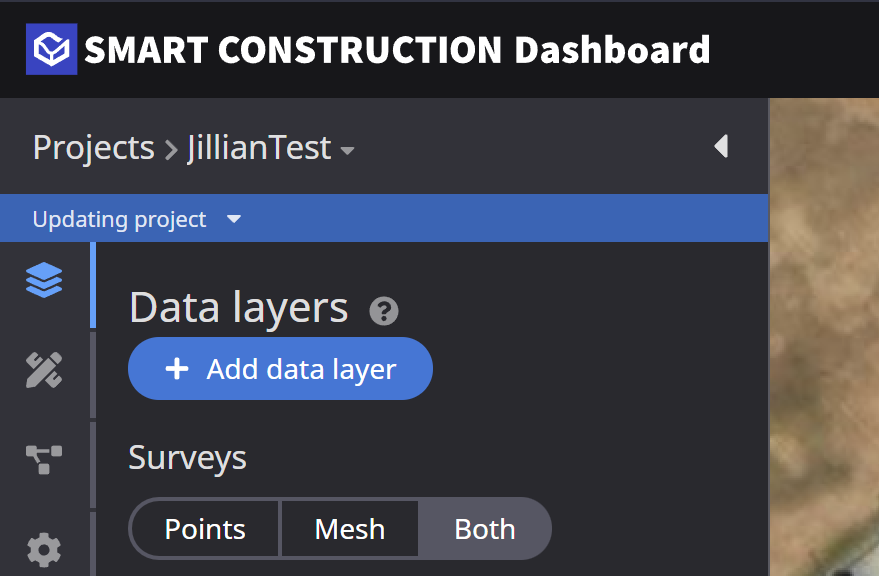
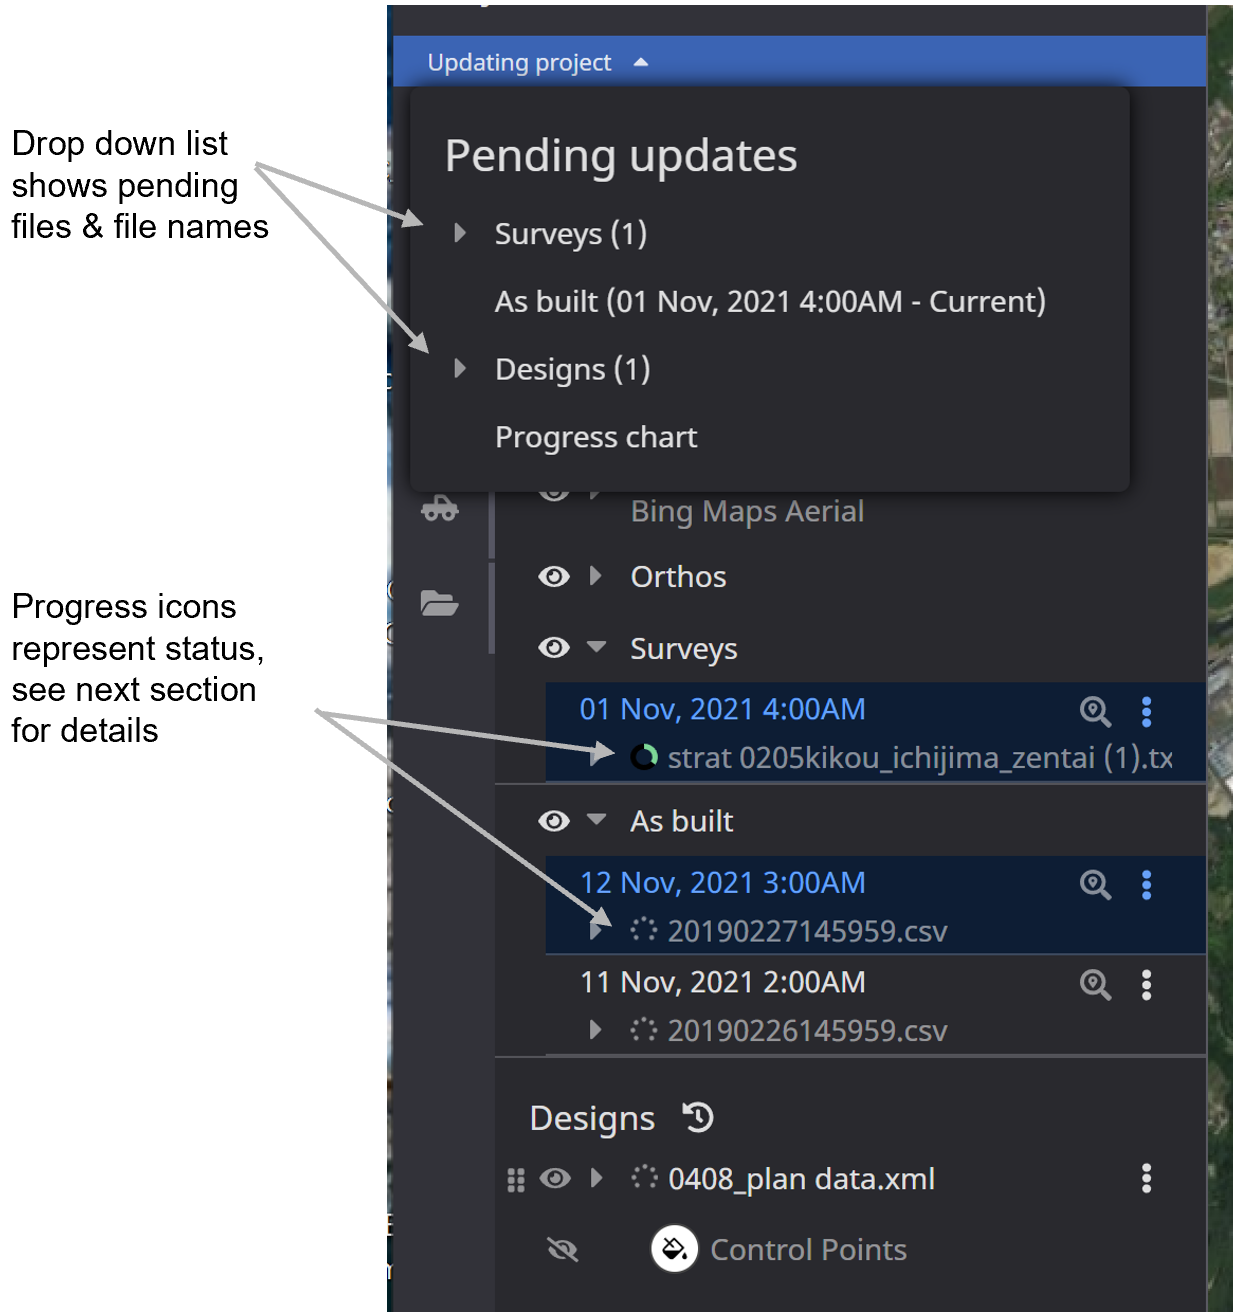
Updating project Files are in the process of uploading or tiling. Drop down arrow will show pending updates.
When files begin uploading, the data layer will appear in the Updating project list. Make sure you leave your browser open while the data layer says Uploading (green donut progress bar) The server will check for any possible updates and necessary retiling when uploading a new file.
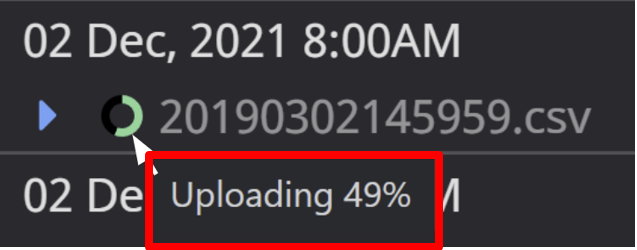
Progress icon definitions
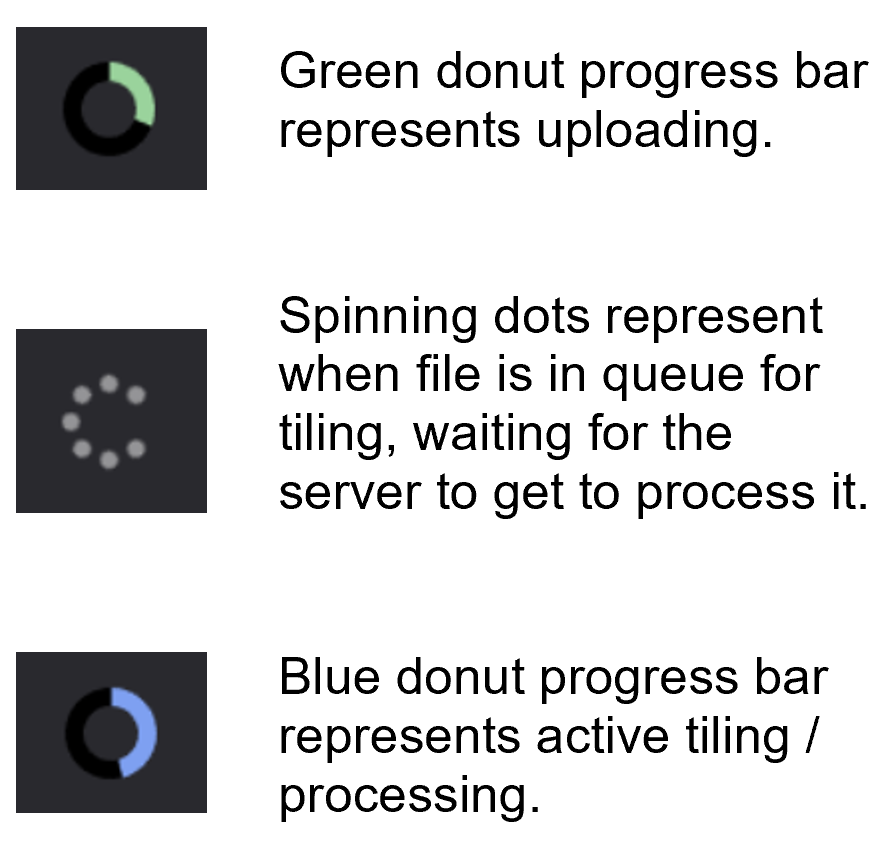
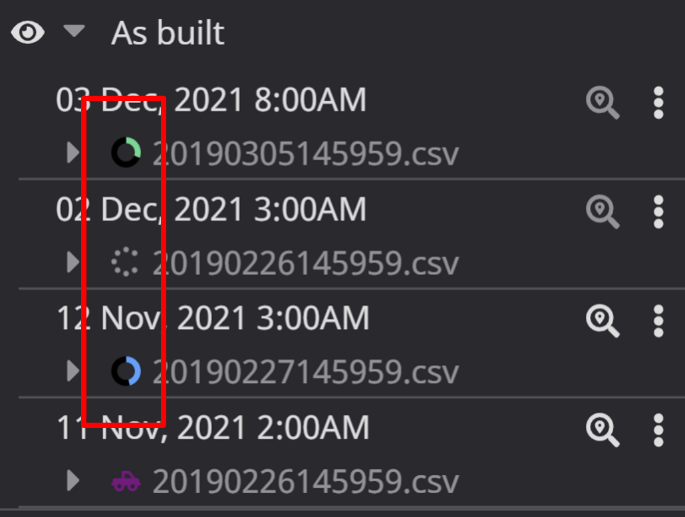
Hovering over a progress icon will make a tooltip with a status label appear.
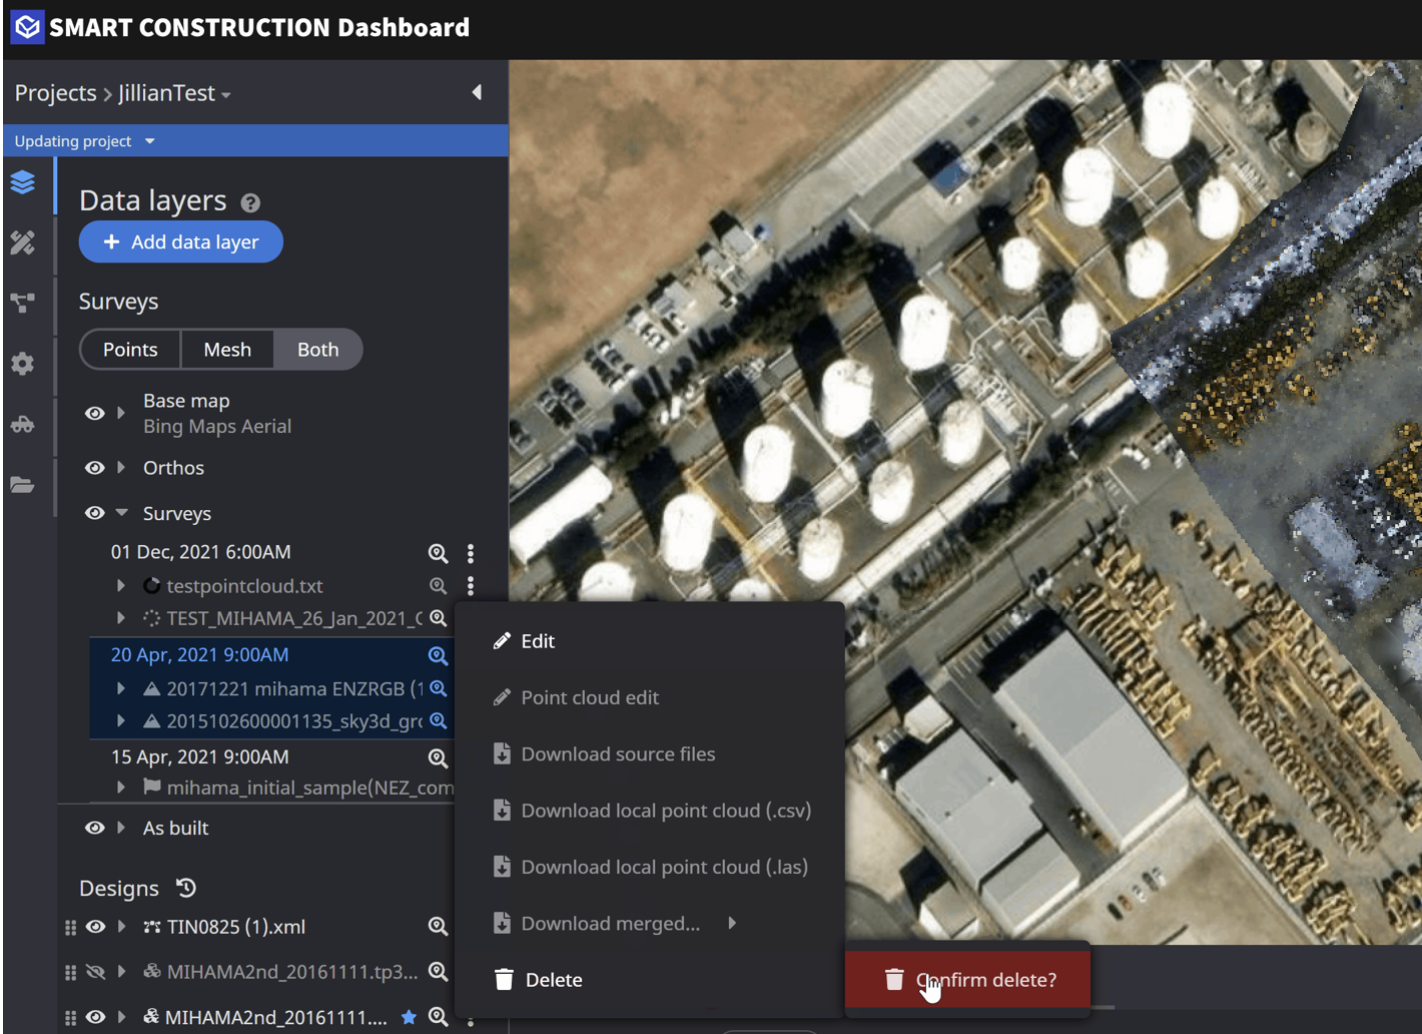
Delete / cancel during upload Users can delete files during the upload process. Click file’s kabob bar you want to cancel > Delete > Confirm delete. Upload will cancel.
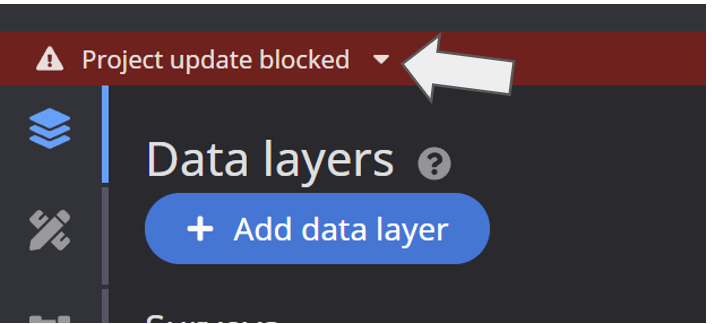
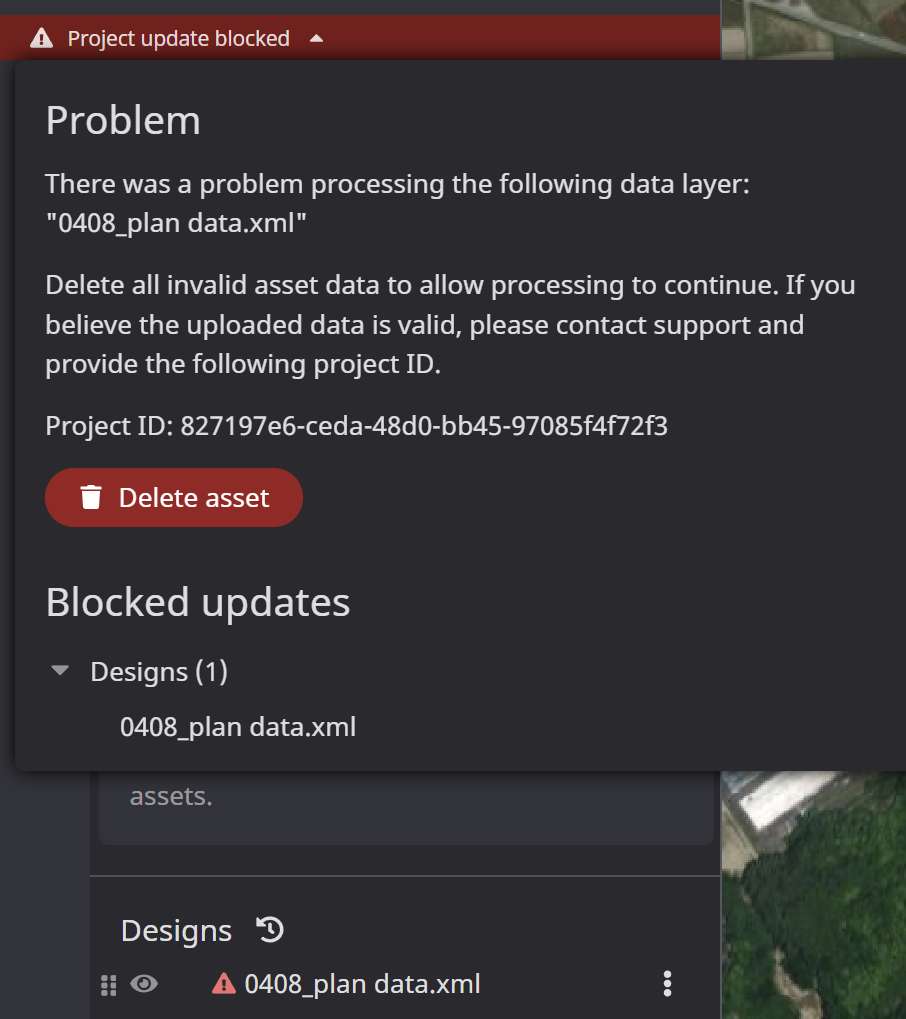
Project update blocked This means something (i.e. a bad file) is blocking the project from further updates. Users can delete files that produce errors and will display updates that are on hold. Can be fixed by deleting the problematic file. Small red symbol indicates a problematic file.
Configure Layer Property
The uploaded data may not be displayed as expected on the 3D View of the Dashboard. This is due to the fact that the design or point cloud file does not properly embed the coordinate system information and unit information at the time the file was created. Dashboard allows users to edit the information in a file after it has been uploaded. If the user re-specifies the coordinate system properly, Dashboard will be able to properly load the file even if the CRS information in the file is incomplete.
Properties able to be changed
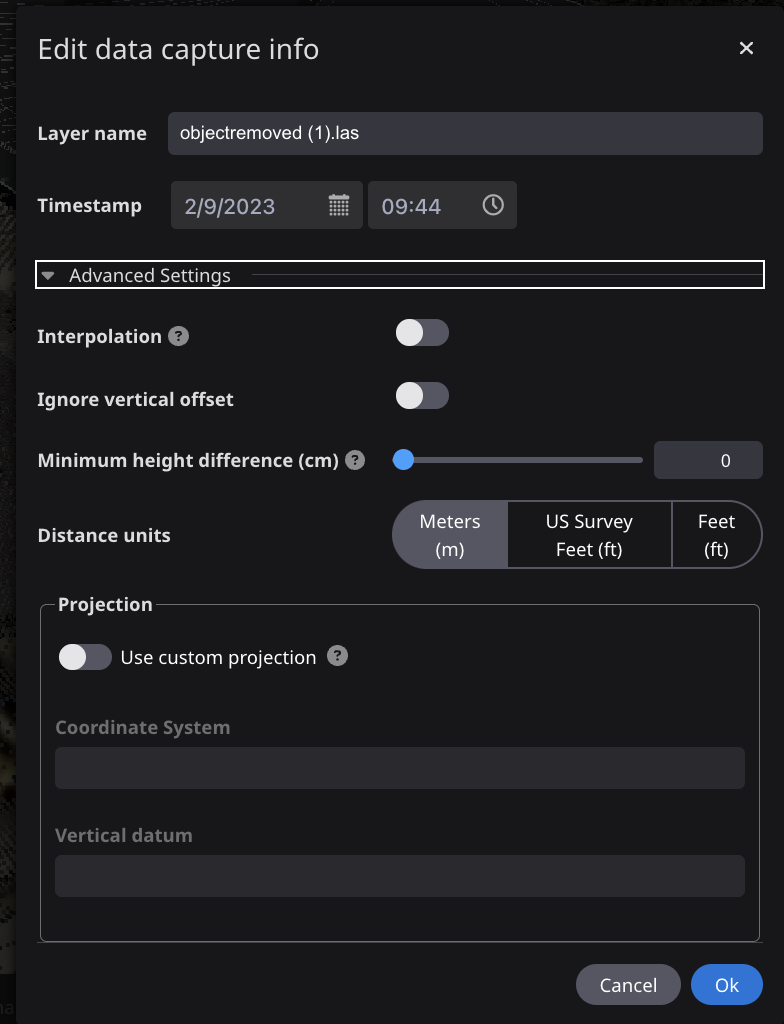
Layer name - Layer name (file name is set as default) can be changed.
Timestamp - Timestamp specfied at the timing of import can be changed.
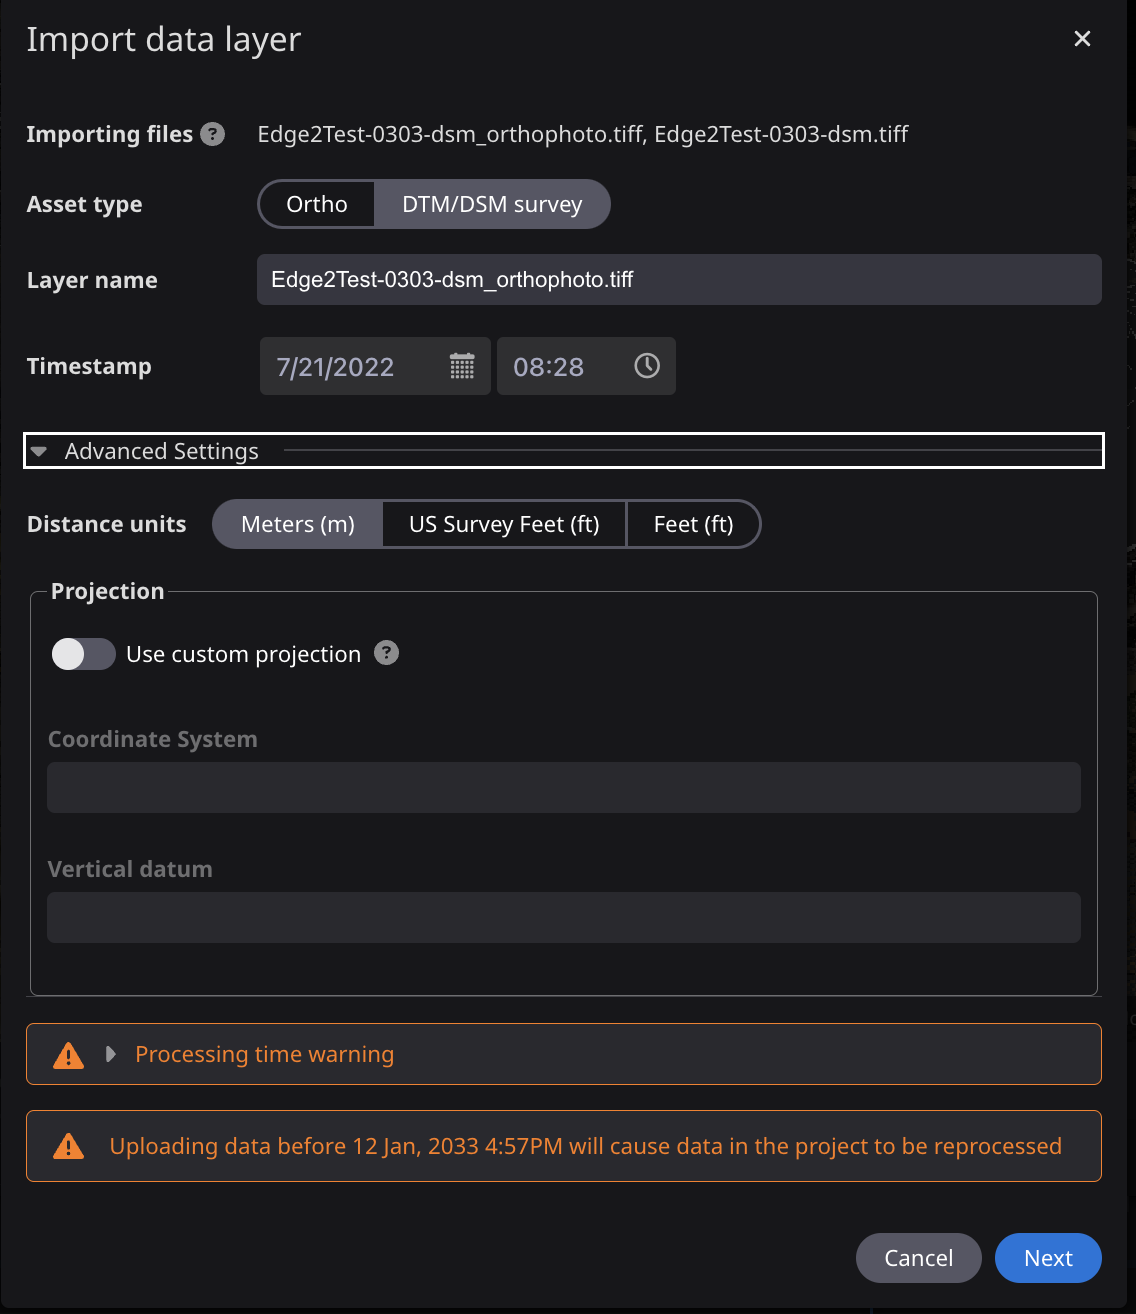
Advanced Setting options
Interpolation - Fill any holes based on surrounding points
Ignore vertical offset - If the project is localized, data will be read as mean sea level. With using this option, Dashboard read data as ellipsoidal height. (Use of this option is deprecated . User can specify ellipsoidal height with by using “Use custom projection.” instead(recommended))
Minimum height distance - Minimum height difference allows you to set a threshold to reduce the impact of fluctuations in a point cloud when performing measurements.
Disntance units - Change the Distance Unit when reading the file. (By default, if the file has an embedded unit, that unit is applied; otherwise, the Project's Distance unit is applied.)
Use Custom projection - choose a coordinate system to use in place of the default. If an asset contains an embedded coordinate system, it is used as the default. Otherwise, the site coordinate system is used as the default.
Please note that after changing Advancd Setting options, Dashboard retiles related data layers. it will take time.
Merging terrain data
Whenever a survey or As Built data layer is added to the project, it is merged with the previous terrain to produce the most up-to-date and complete view of the entire site. Where data isn’t available from the most recent data set, the last available data is used.
Registering a design surface as the target design
Any design layer with surface data can be registered as the target design surface. This is the default design surface that will be used for volume and progress measurements. The target design layer is labeled with the start icon.
The target design for a jobsite must be set by the user by:
- Clicking on the context menu
- Select Set as target design.
- Review the Change Target Design content and select Submit Change.
- The selected layer will be set as the target design.
Target Design History
Any changes to the Target Design are captured by SC Dashboard in the Target Design History. The following changes to the target design layer are tracked in the history:
- Changes to target design layer *
- Changing the name of the target design layer
- Deleting the current target design layer *
Important – Changing or deleting the current Target Design will result in re-tiling of all project layers and a re-calculation of the Progress and Daily progress chart measurements.
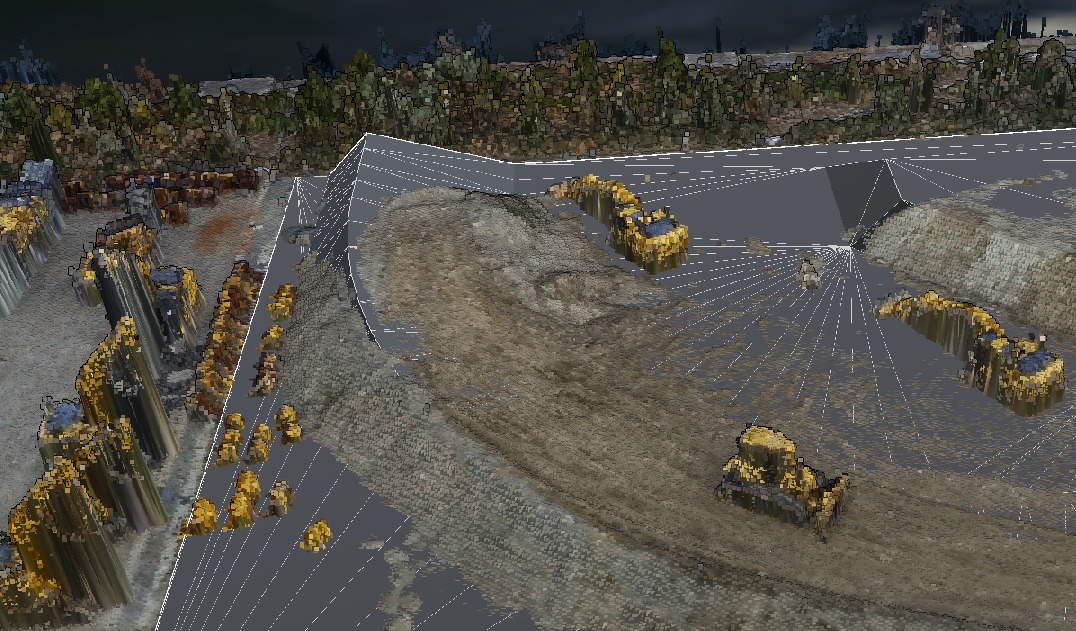
Surface display
Survey and As Built surfaces can be displayed as points, mesh, or a combination of both. The default is points. To change the display, use the radio buttons on the Data layers panel to choose your preferred display type.
Points displays the surface as individual-colored points.
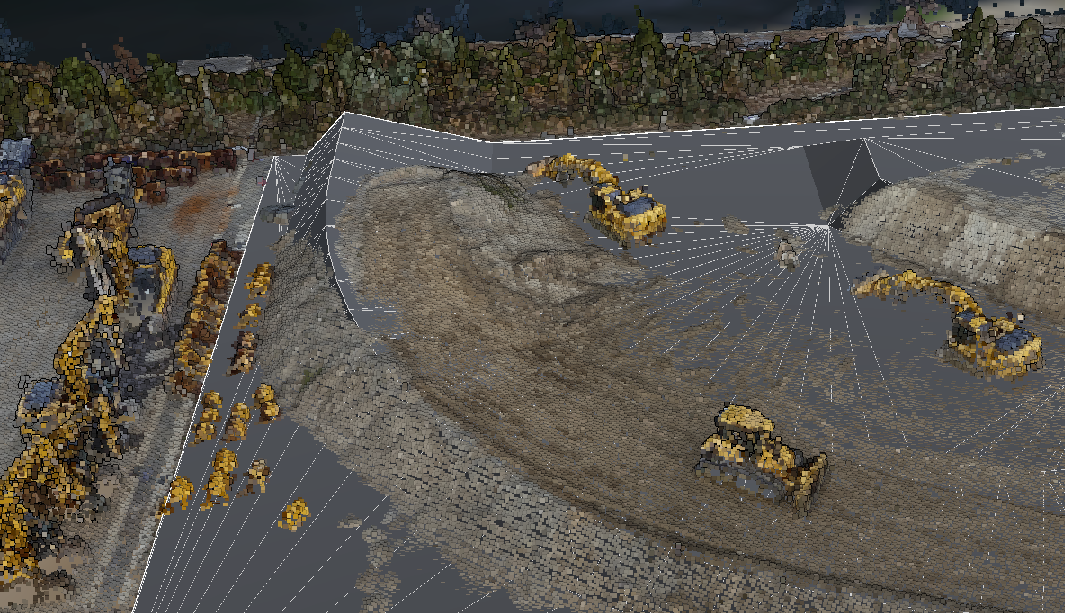
Mesh displays the surface as an image overlaid over a triangle mesh, or TIN.
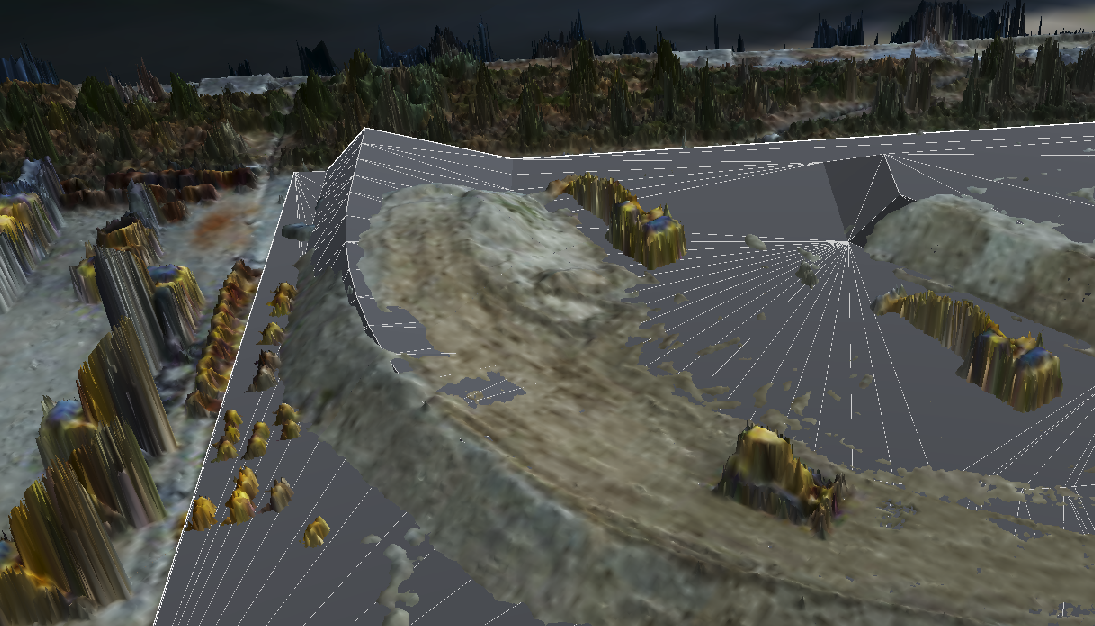
Both displays both Mesh and Points surfaces in the 3D View
Editing survey data
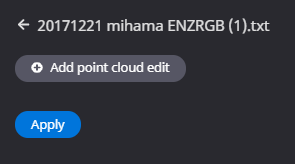
Survey point cloud data can be modified to remove vegetation, equipment, or other objects that should not be included in volume or surface measurements. To edit, chose a Survey layer, open the context menu (click ), and click Point cloud edit. This will open the Point cloud edit panel.
Add a new point cloud edit by clicking Add point cloud edit.
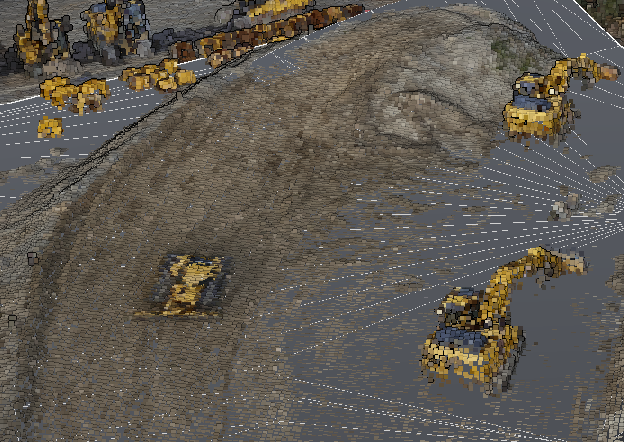
Click within the 3D View to define a polygon around the area you want to remove. You can click Edit button to alter the shape of the polygon. You can click Delete button to delete the selected polygon
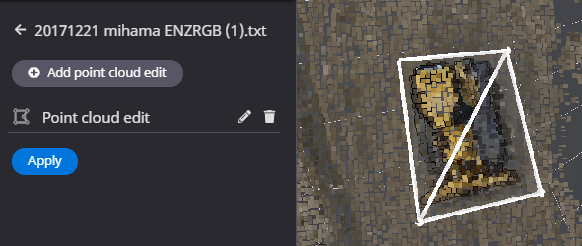
Click Apply to begin the re-processing of the point cloud to remove or flatten the area within the polygon. Once the processing completes the display will update with the new surface. You can always remove the edited areas by accessing the Point cloud edit menu and deleting any areas you have added.
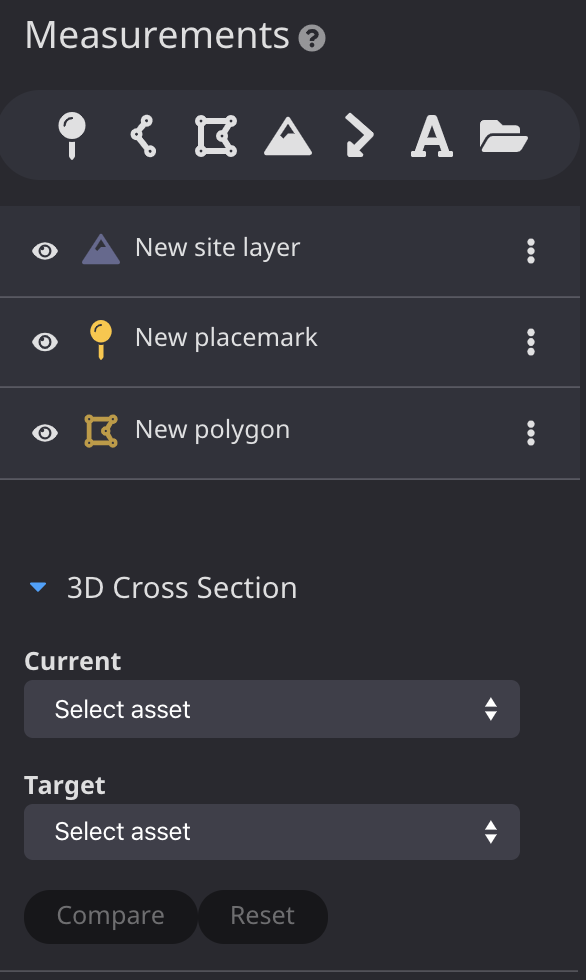
Annotations
Annotations are objects you click to add - you can draw a polygon, add a placemarker, and more. Annotations are a way of marking up your scene with additional information useful for your project analysis. After making an annotation, you can add one or more measurements to the annotation, such as elevation profiles, slope and cut and fill calculations.
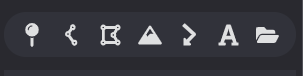
- Annotation Tools – Use these tools to create annotations. See Create annotations
- Current Annotations – List of the current annotations in the project.
- 3D Cross Section – Controls for 3D Cross sections
- Terrain Guides – Elevation, slope and contour visual guides.
Placemark Take measurement for a specific position.

Line Analyze cross sections and distances over a selected path.

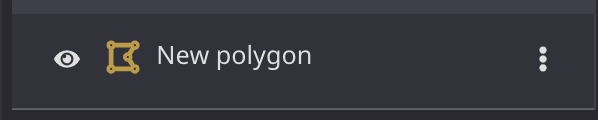
Polygon Analyze cut and fill volumes and other measurements for a selected area.

Site Analyze cut and fill volumes and other measurements over the entire jobsite.

Arrow Annotate a path or direction.

Text Annotate with text.

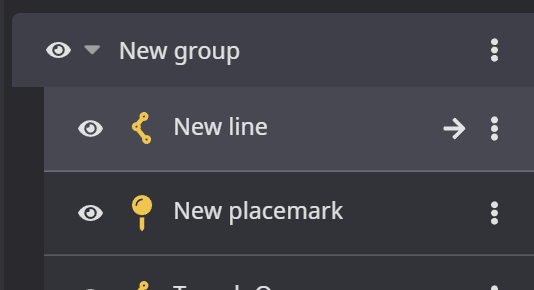
Group Create a new empty group layer. Drag annotations into a group.

Create annotations
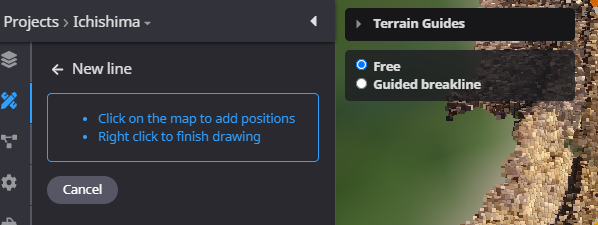
Select the annotation type you would like to create. Depending on the type of annotation selected you will use the view to collect points to define the annotation. Placemark – Collect a single point Line – Collect points to define a line Polygon – Collect points for a polygon Arrow – Define a line Text – Define a point
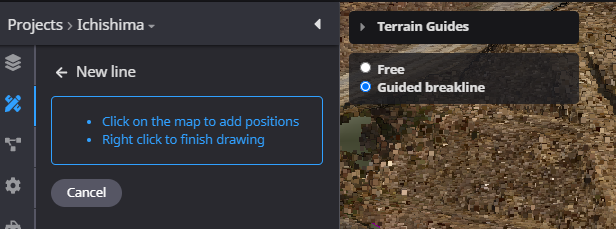
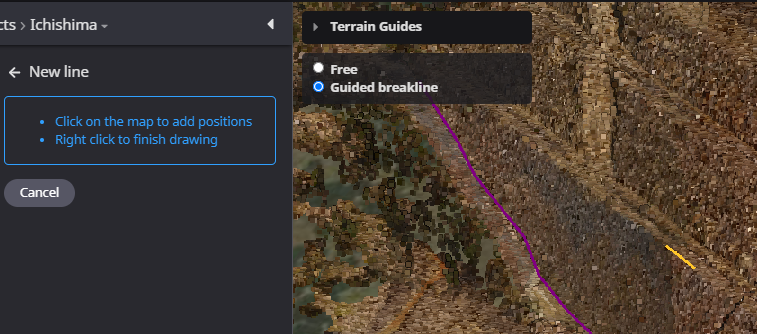
In this example we are creating a line annotation. Click on the map to add positions. See collection methods for details on Free and Guided breakline options. When you are done right-click to end the line.
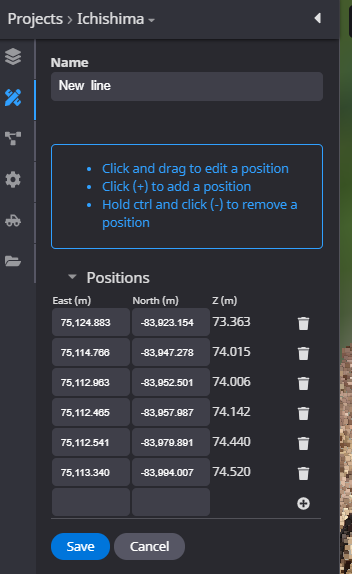
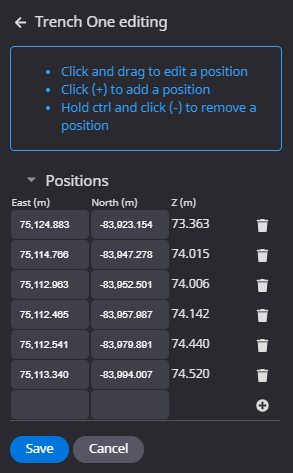
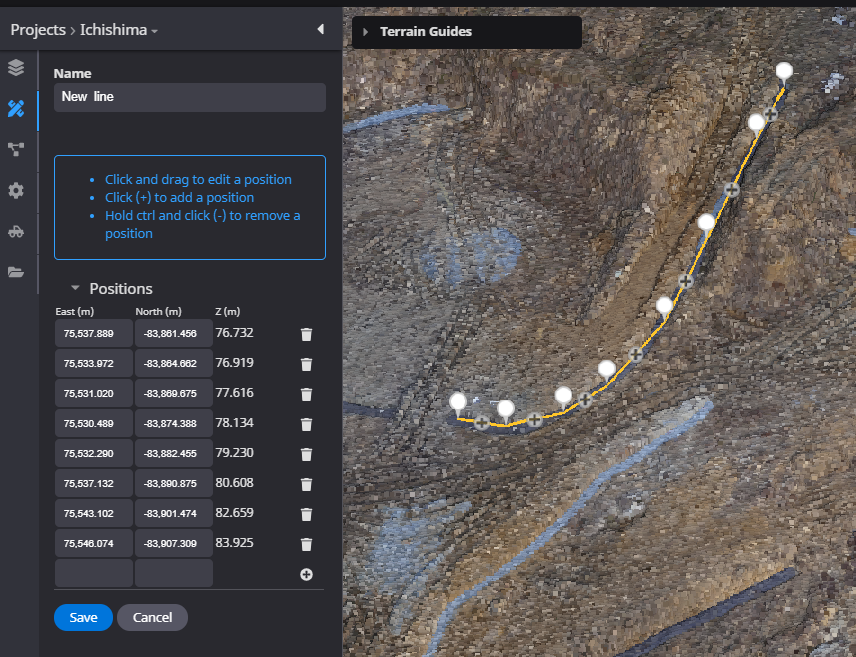
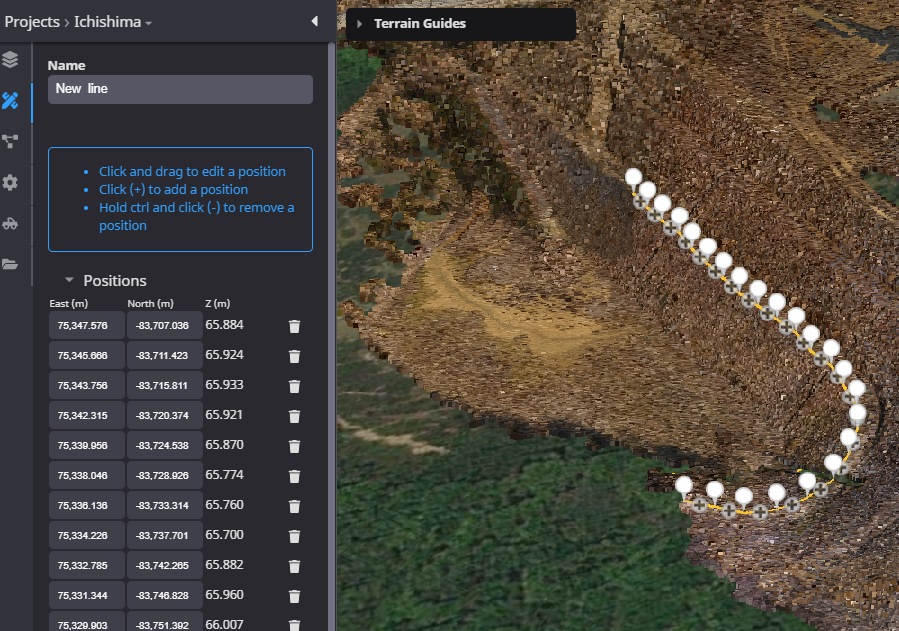
Under Name you can enter a name for the annotation. The positions (vertices) are displayed in a list. You can edit the X,Y values of the line directly in the list, or you can edit them within in the display Click Save to save your new line annotation.
The new annotation is created. See Edit annotations for details on editing existing annotations.
Edit annotations
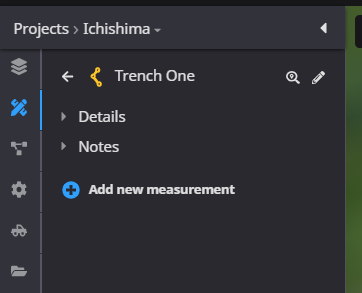
To edit an annotation, select it from the Annotation list by clicking on the arrow.
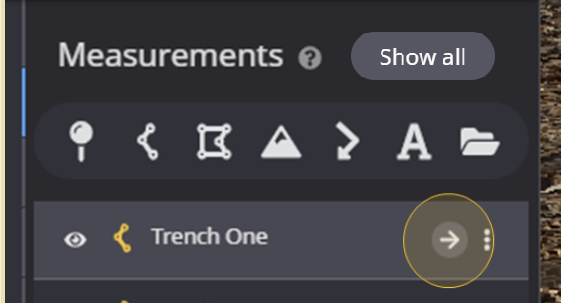
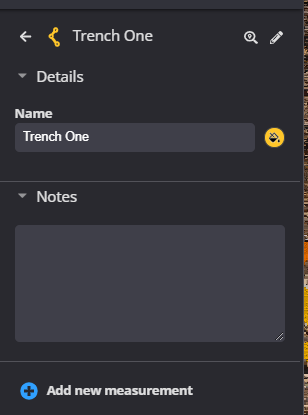
This will open the annotation where you can edit the positions, set the name, add notes, or add a measurement.
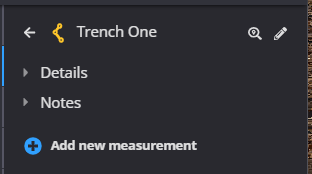
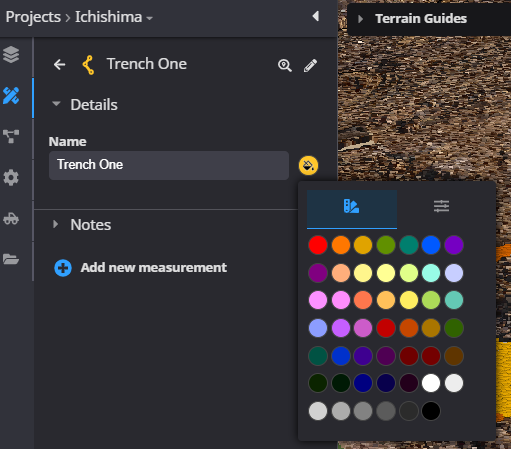
Open the Details panel to edit the name of the annotation, or to set the color of the annotation.
Click the edit icon in the top right of the panel to edit the annotation positions.
Make annotation notes
Each annotation can contain notes. To edit the notes of an annotation, open the Notes panel and type to add any notes.
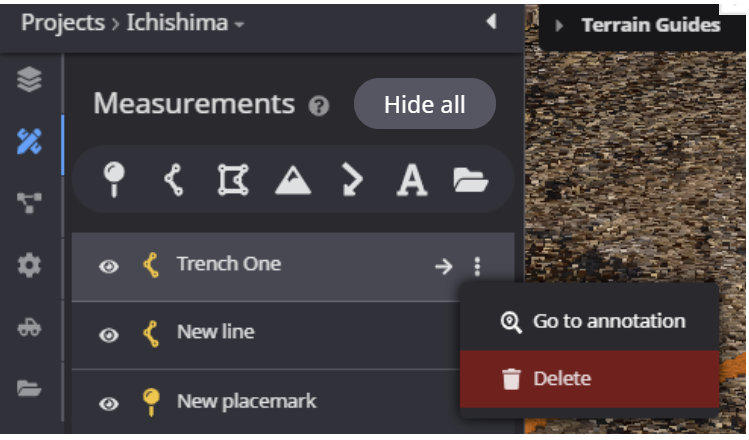
Delete annotations
To delete an annotation, select the annotation from the Annotation list. Click icon to open the side menu. Select Delete
Group annotations
Annotations can be sorted into groups.
Create a new group by clicking the Group icon in the annotation toolbar.
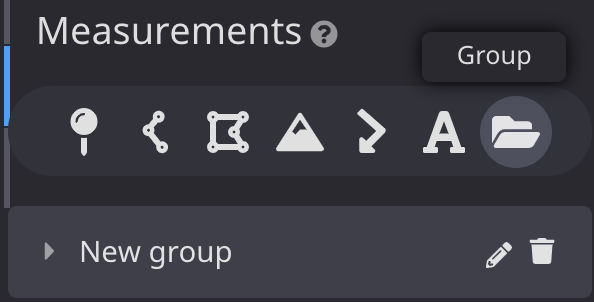
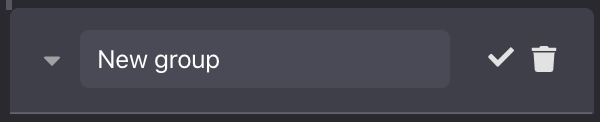
Rename a group by clicking edit icon Enter a name and click the confirm icon
Add an annotation to a group by dragging an annotation into the group folder.
Remove an annotation from a group by dragging the annotation out of the group folder.
Annotation collection modes
Line and polygon annotations can be collected using two modes:
Free – Allows you to click anywhere in the view to collect/define your annotation.
Guided breakline – After the users provides two starting points, the Dashboard application will automatically collect similar points. This allows you to quickly collect annotations along, or at the bottom of, a ridge line, stockpile, or temporary road.
Free collection mode
Select the annotation type you would like to create. In this example we are creating a line annotation.
Click on the map to add positions. When you are done, right-click to end the annotations
You will see a list of the points you collected. The points are also displayed in the view. You can edit the points in the list by typing in X, Y values. You can also change the points by clicking and dragging them in the display. Click Save to save your new line annotation.
The new annotation is created. See Edit annotations for details on editing existing annotations.
Guided breakline collection mode
Select the annotation type you would like to create. In this example we are creating a line annotation.
Select the Guided breakline option. The guided breakline requires you to enter two points to define the Direction, point spacing, and grade that will be used to automatically collect additional points.
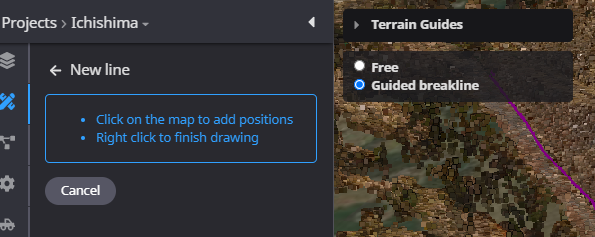
Typically, along a ridge line, or at the bottom of a stockpile. Collect the first point. Collect the second point.
After the second point is collected, the application will determine additional points with similar grades and add them to the line. You can edit the collected points as needed. Click Save to save your new line annotation.
The new annotation is created. See Edit annotations for details on editing existing annotations.
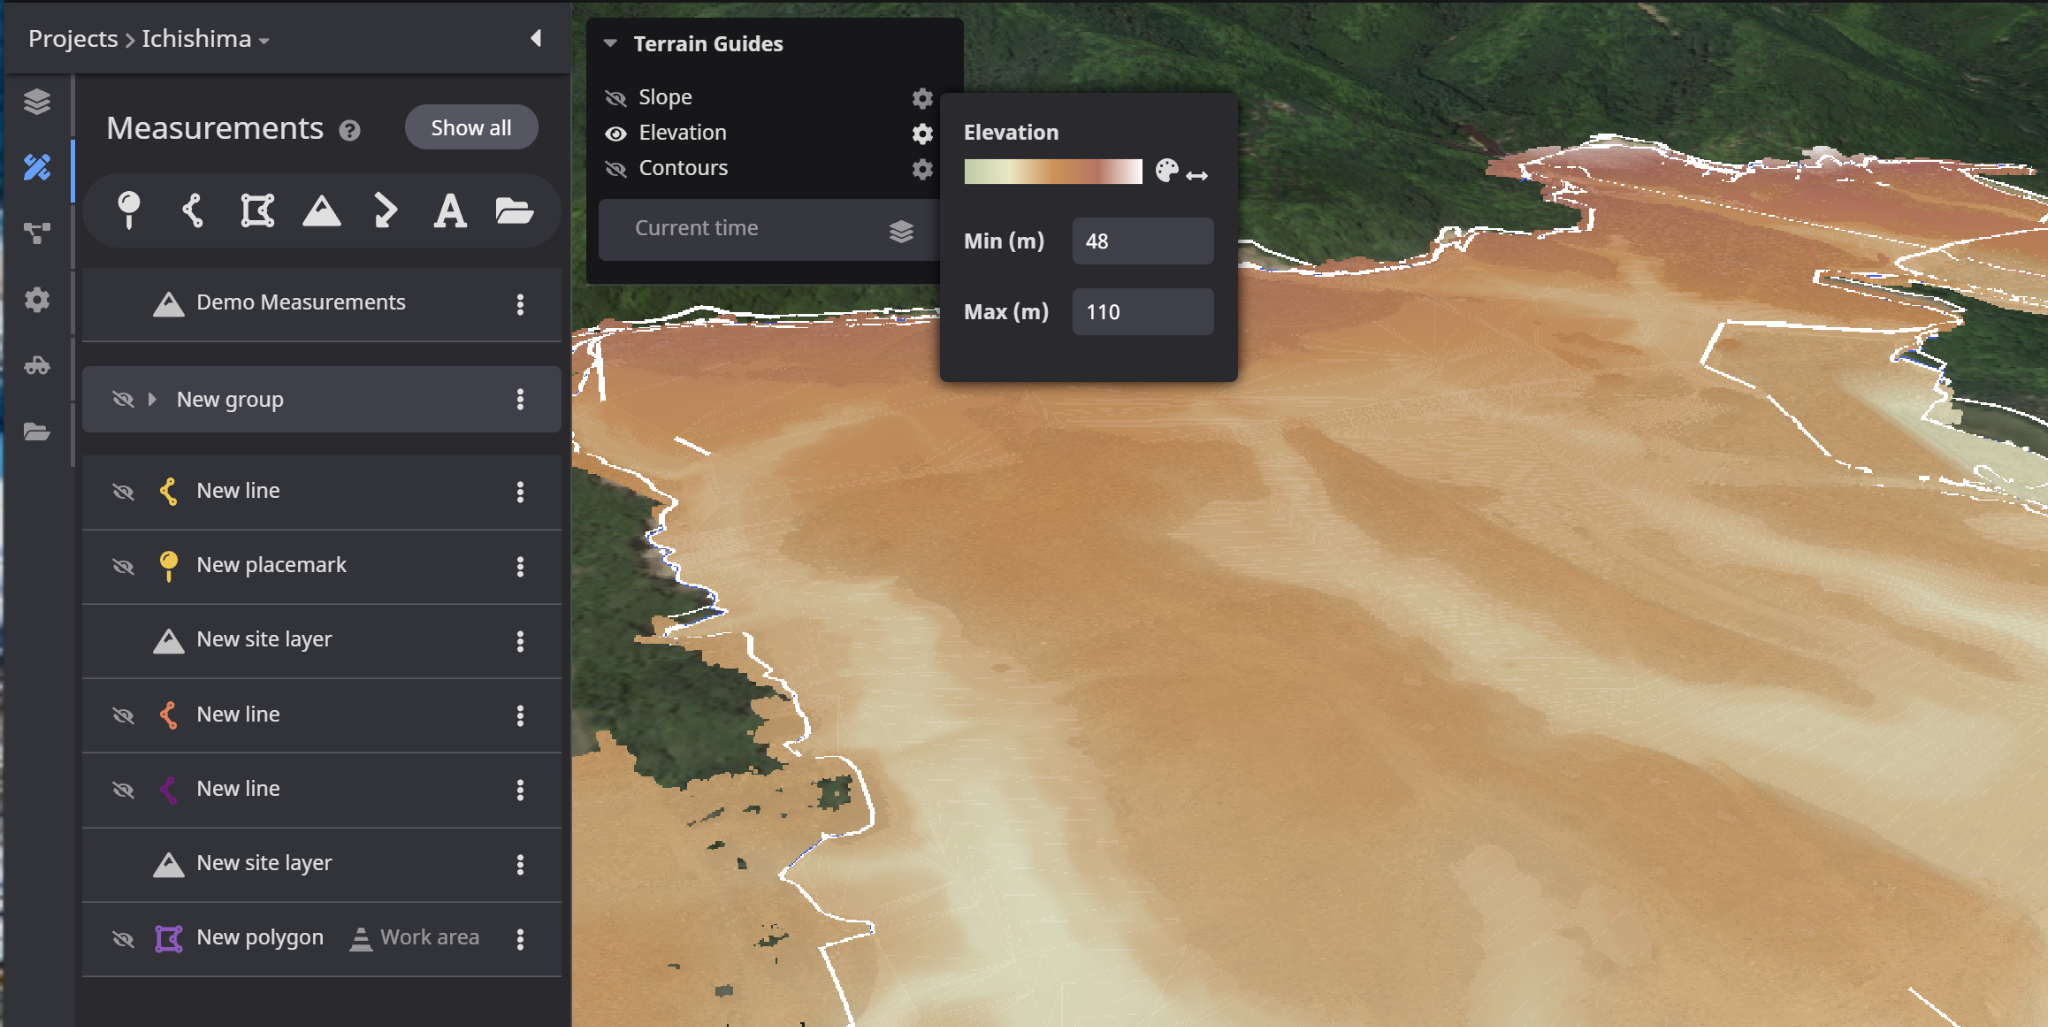
Terrain Guides
To help with the collection of annotations, Terrain Guides provide quick access and display to Slope and Elevation measurements along with Contours.
Within the Terrain Guide menu, there are the following options:
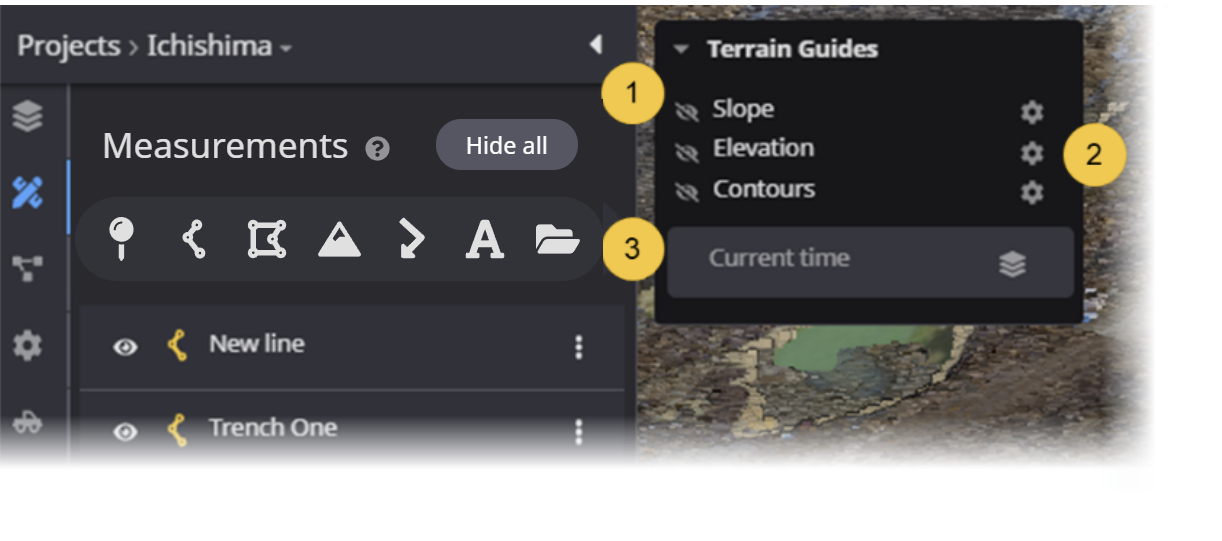
- Toggle the visibility of the terrain guide on / off.
- Configure a terrain guide type.
- Select the surface to be used for the terrain guide. The default is the Current time. You can select any Design surface, Survey or As Built layer.
The terrain guides are available within the Measurement and Annotation panel.
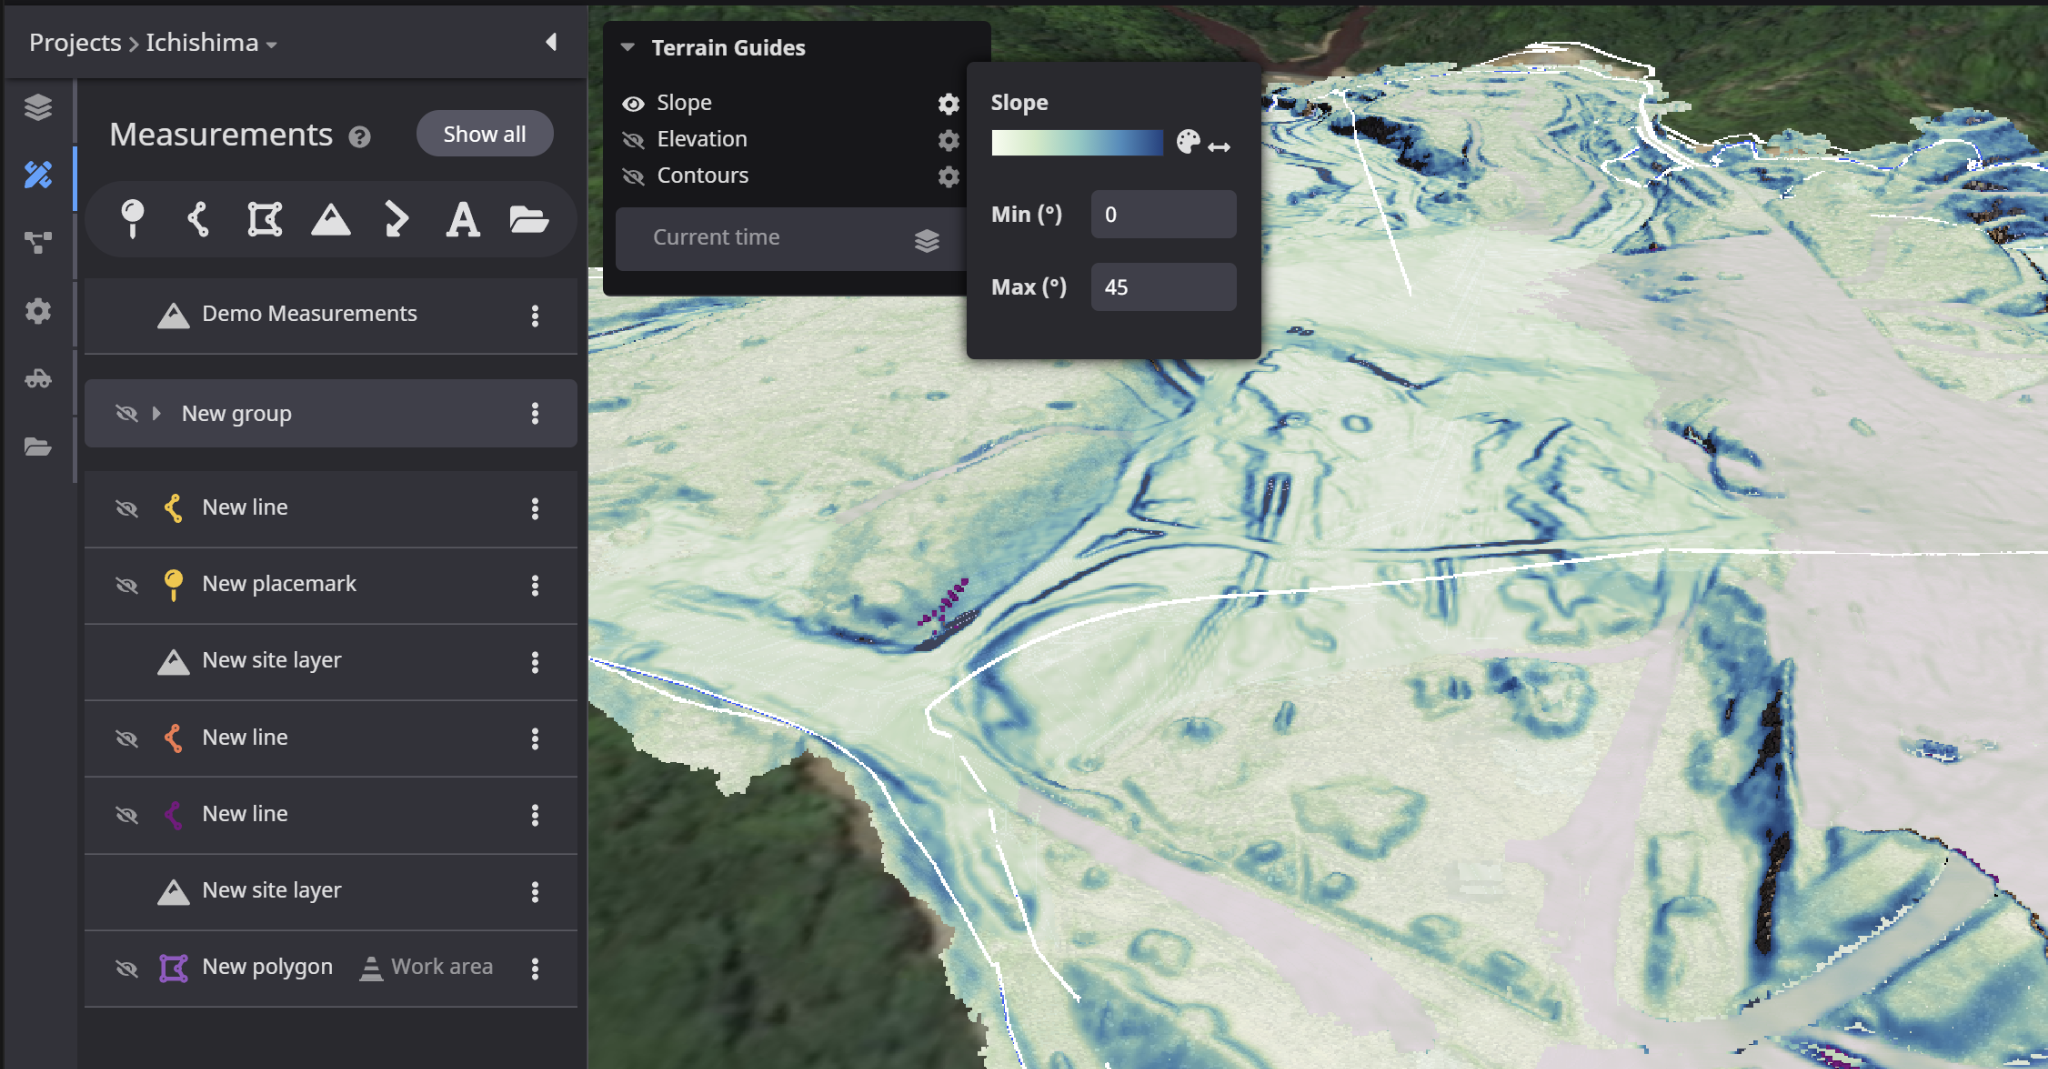
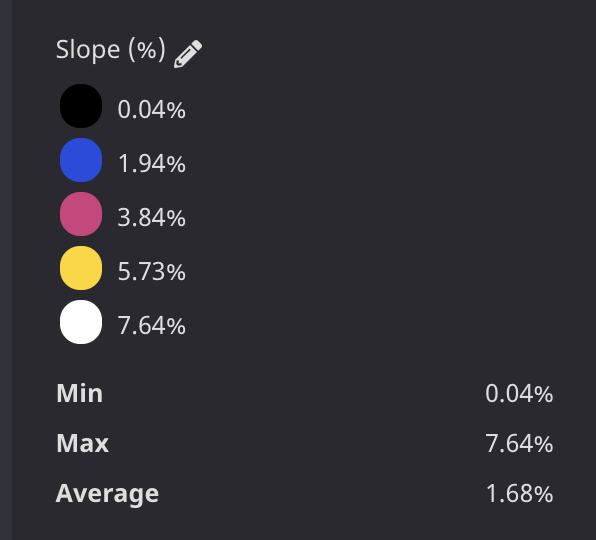
Slope
Displays the slope values of the selected surface. You can change the Minimum and Maximum elevation values along with selecting a color ramp.
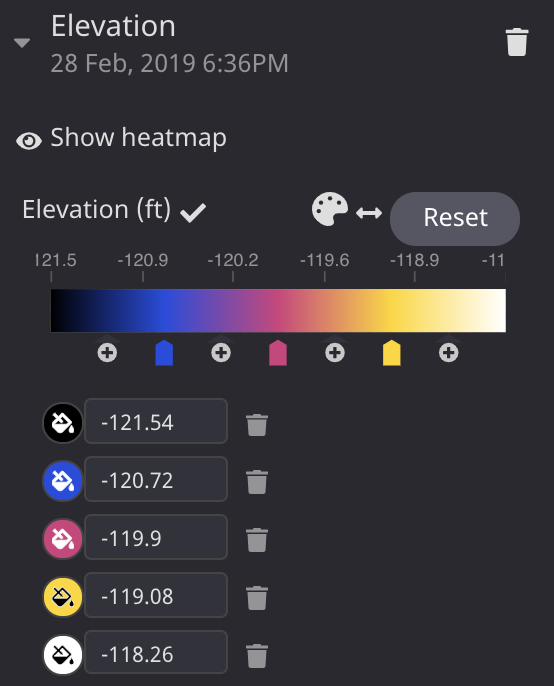
Elevation
Displays the elevation values of the selected surface. You can change the Minimum and Maximum elevation values along with selecting a color ramp.
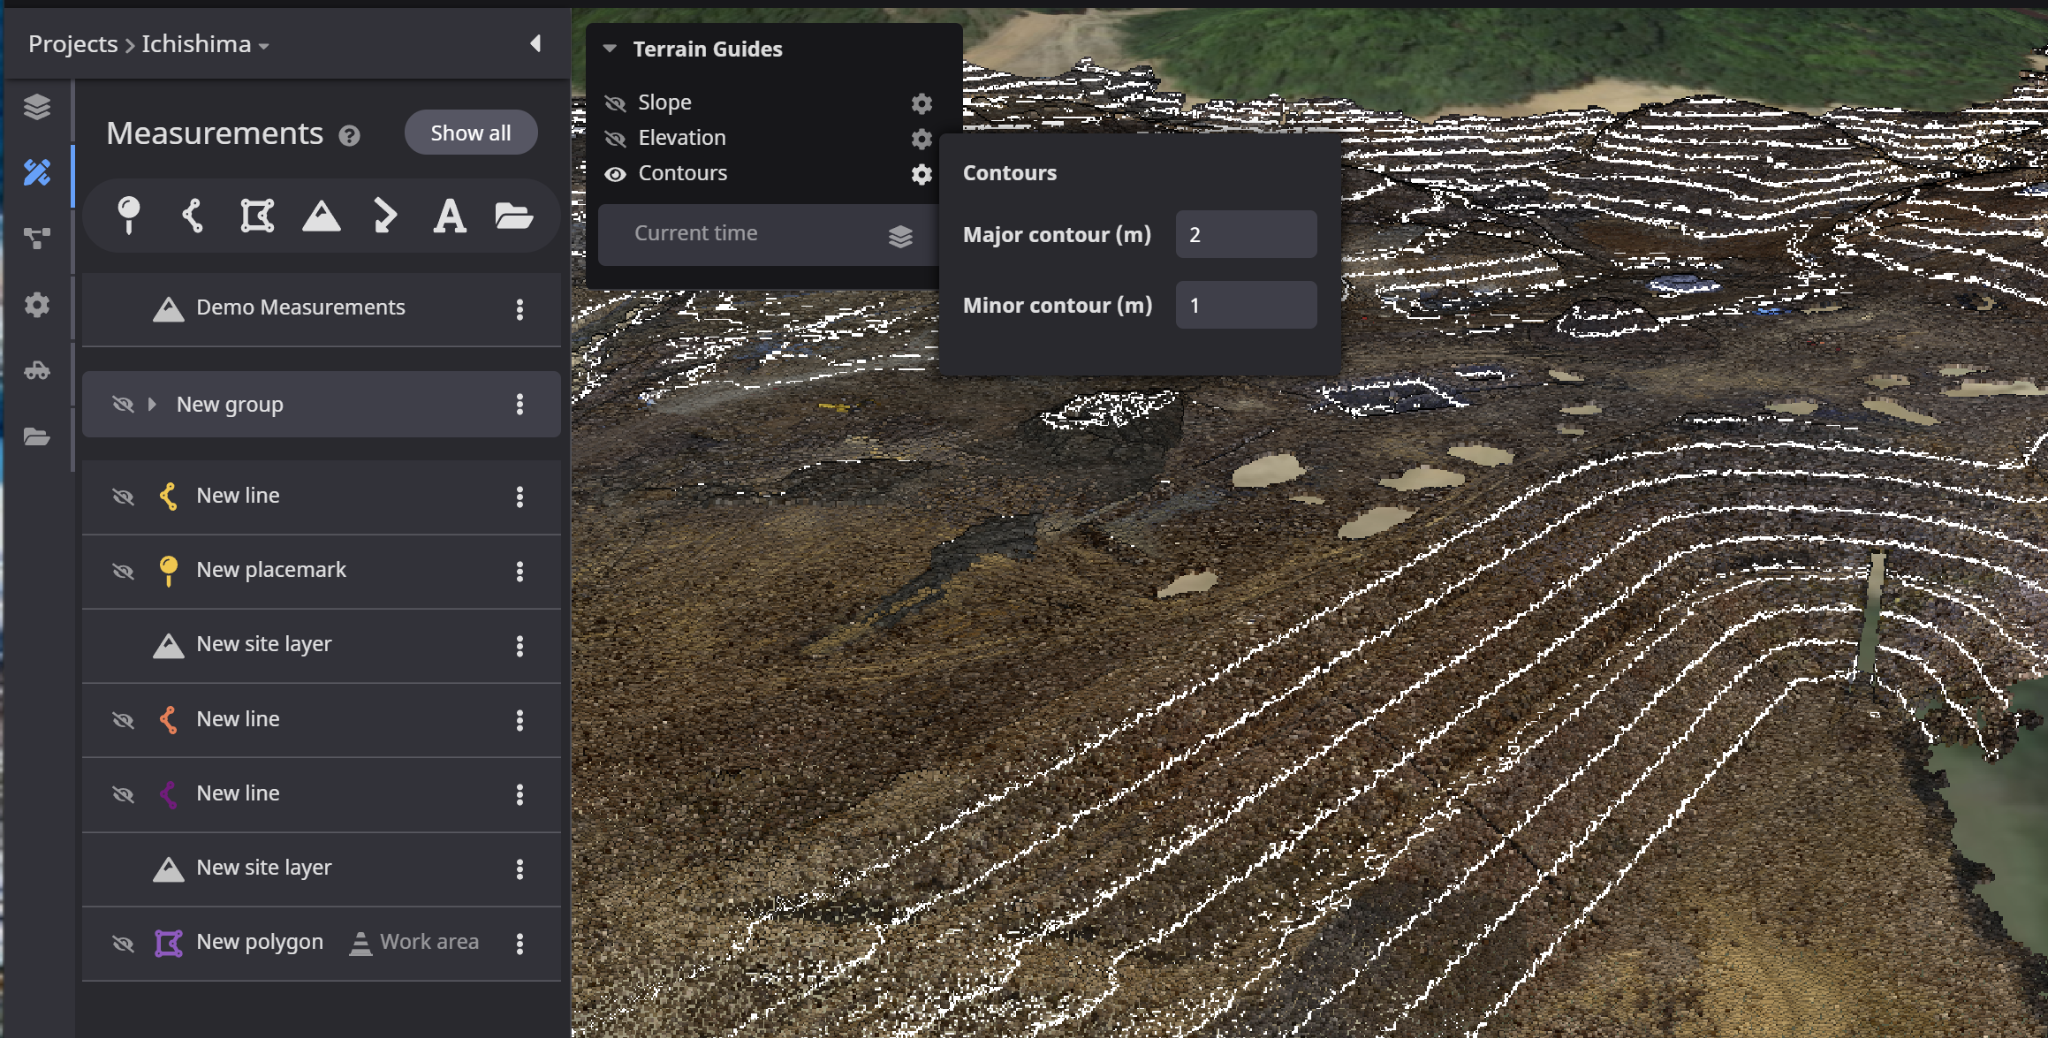
Contours
Displays the contours of the selected surface. You can change the Minimum and Maximum elevation values along with selecting a color ramp.
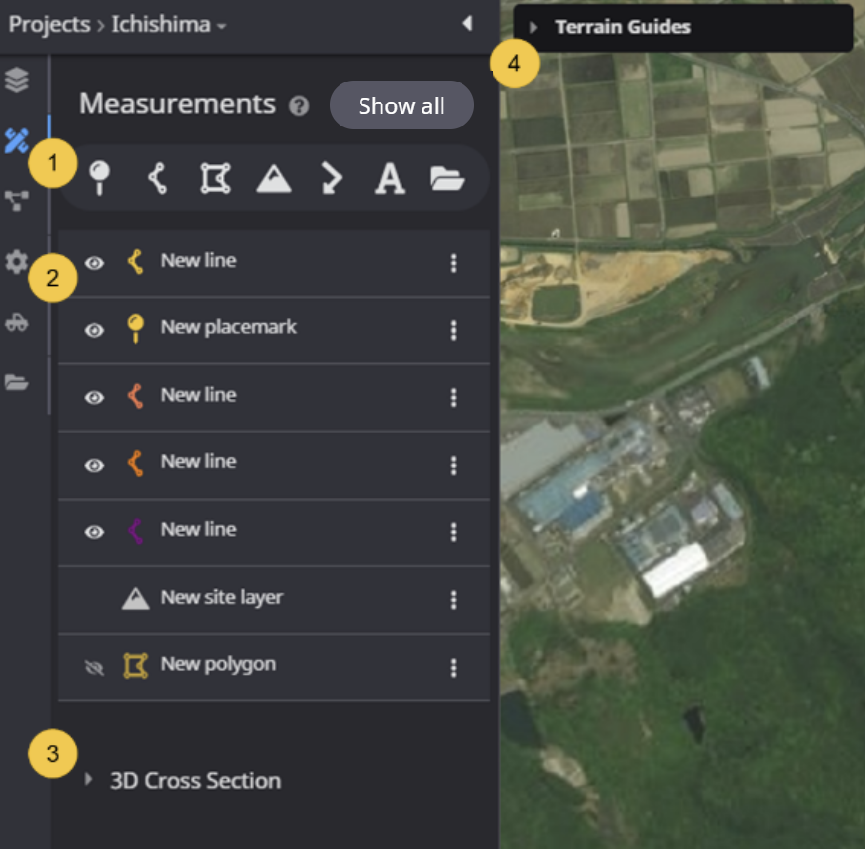
Measurements
Measurements are associated with annotations. Each annotation type has a different set of available measurement types. One annotation may have one or more measurement types associated with it. The following are the available measurements for each annotation type:
- Placemark
- Elevation
- Slope
- Elevation History
- Line
- 2D Cross Section
- Surface Distance
- Horizontal Distance
- Point to Point Distance
- Slope
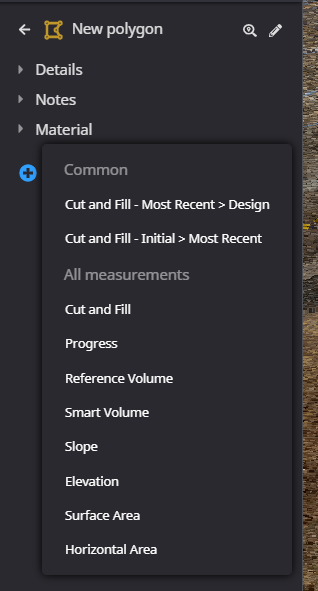
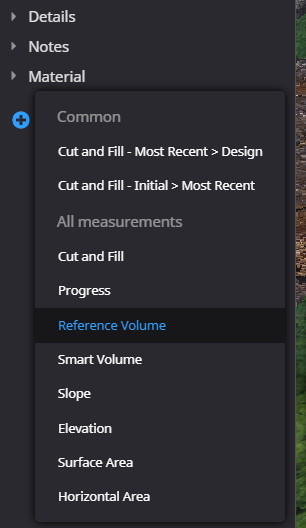
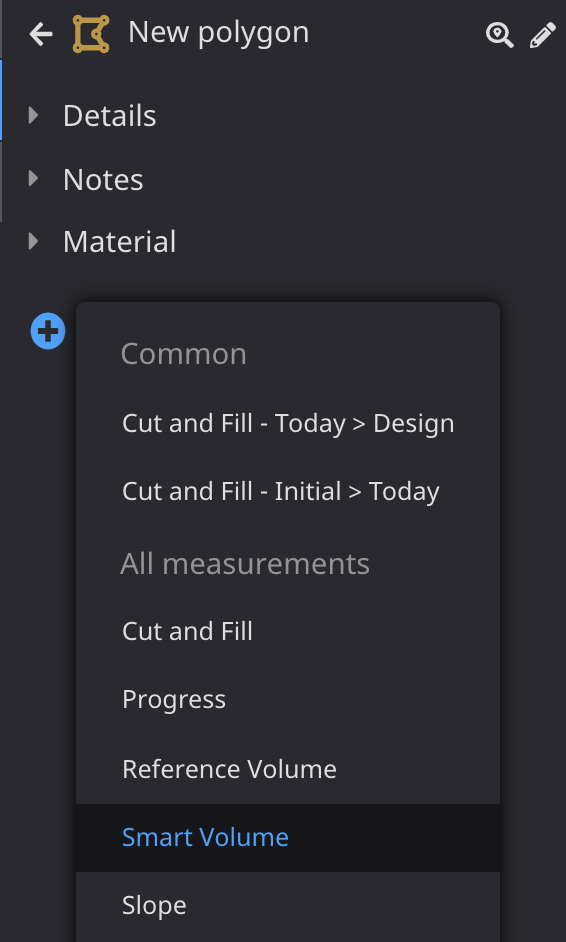
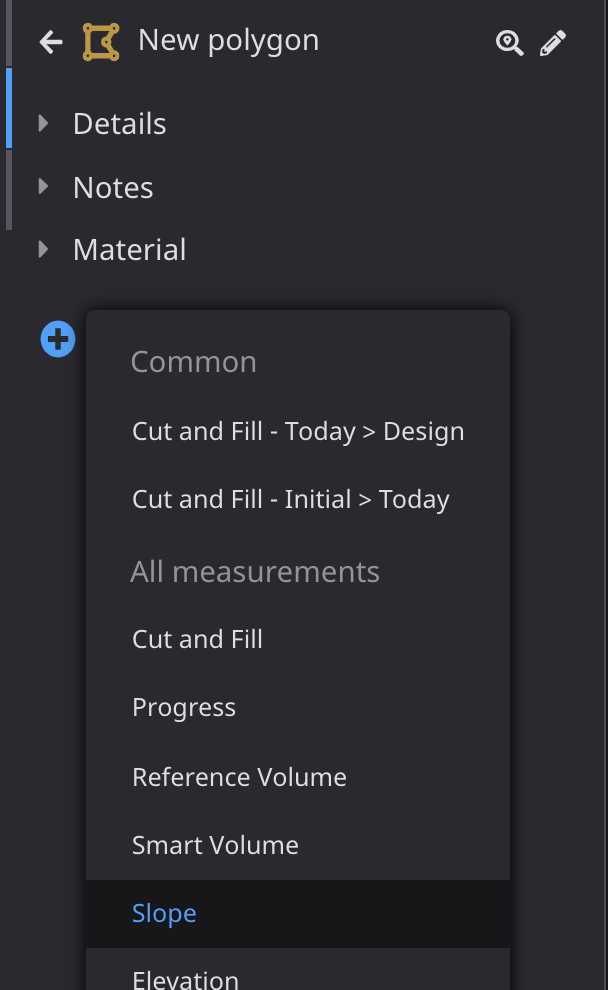
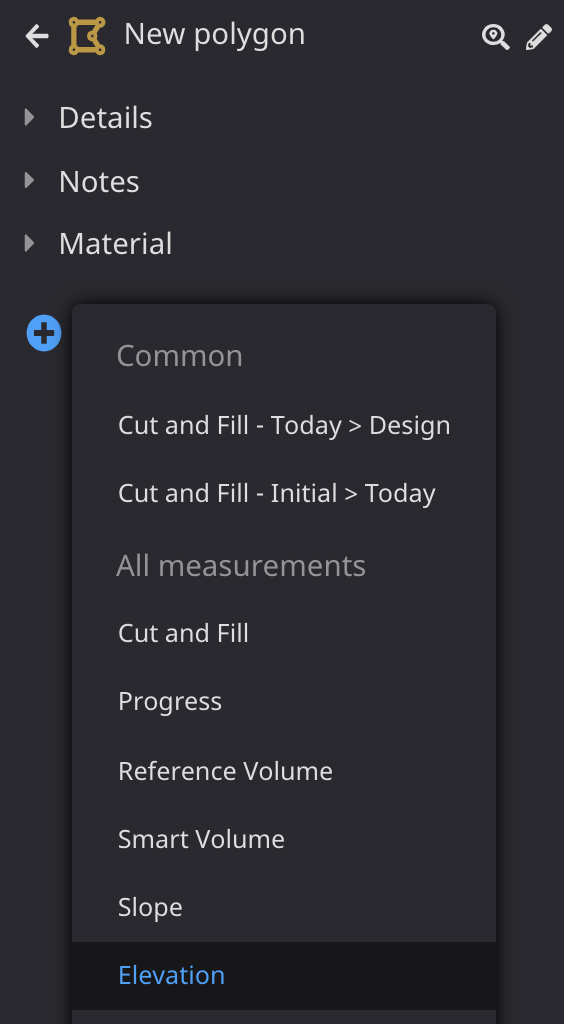
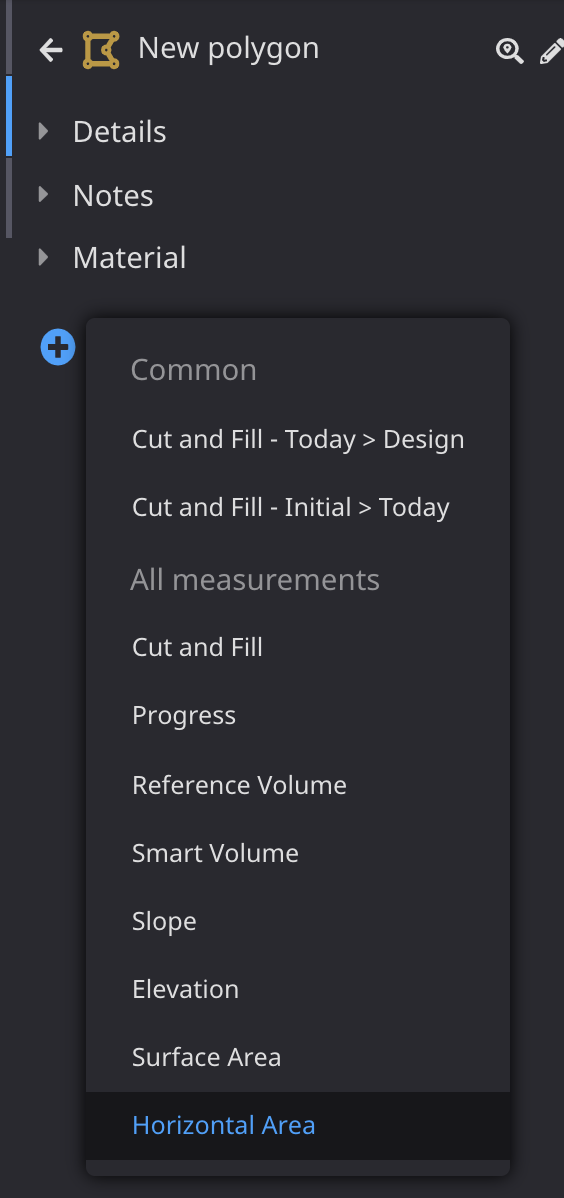
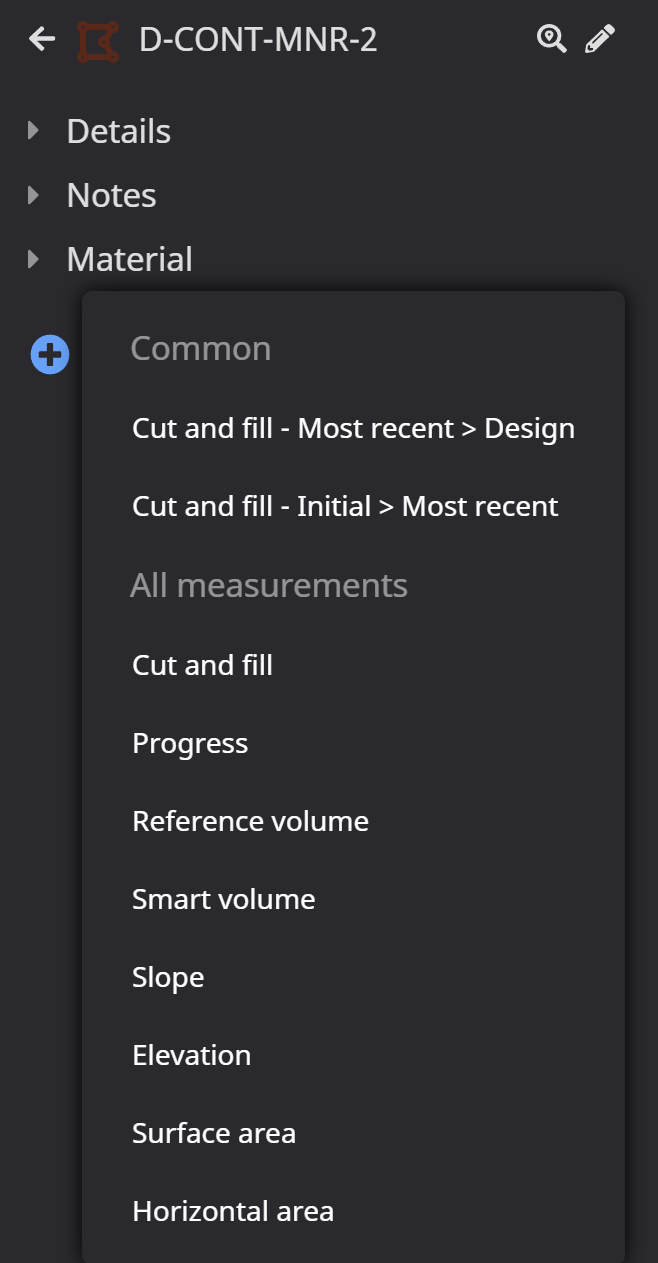
- Polygon
- Cut and Fill – Most Recent > Design
- Cut and Fill – Initial > Most Recent
- Cut and Fill
- Progress
- Reference Volume
- Smart Volume
- Slope
- Elevation
- Surface Area
- Horizontal Area
- Sitewide
- Cut and Fill – Most Recent > Design
- Cut and Fill – Initial > Most Recent
- Cut and Fill
- Progress
- Slope
- Elevation
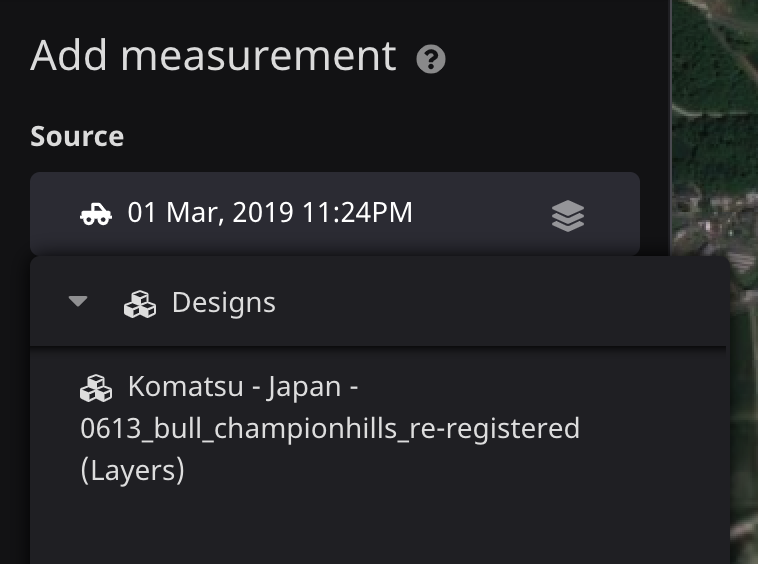
Selecting a surface to measure
Most measurements can optionally select a surface or surfaces to measure.
To specify a surface from survey data and/or As Built data, click Terrain and select an available date from the list. The selected surface will contain height data from the most recent source and fall back to previous surfaces. Surface data that was most recently updated by uploaded or imported survey data will have the survey icon. Data that was most recently updated by new As Built information will have the machine icon.
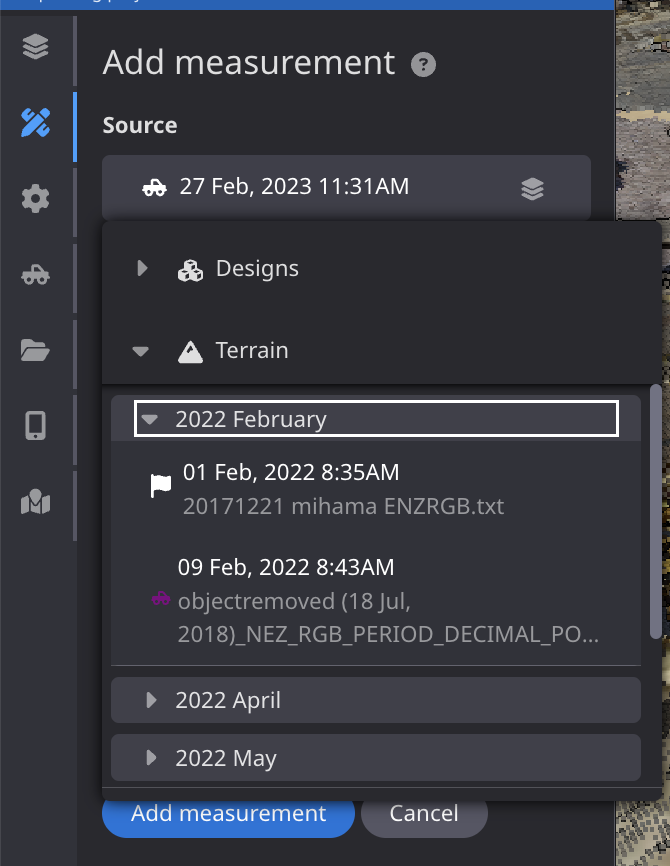
To specify a design surface (TIN), click Designs and select the design model from the dropdown list. The target design surface, if registered, will be the default option.
Placemark measurements
Go to the new placemark you created. Select Add new measurement. You may select one of the options below: Elevation, Slope, and Elevation History.
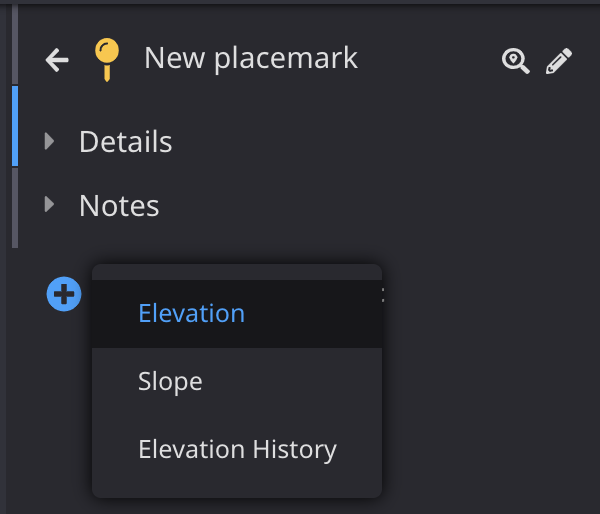
Elevation Measure the elevation of survey data or a design.
Slope Measure the slope of survey data or a design.
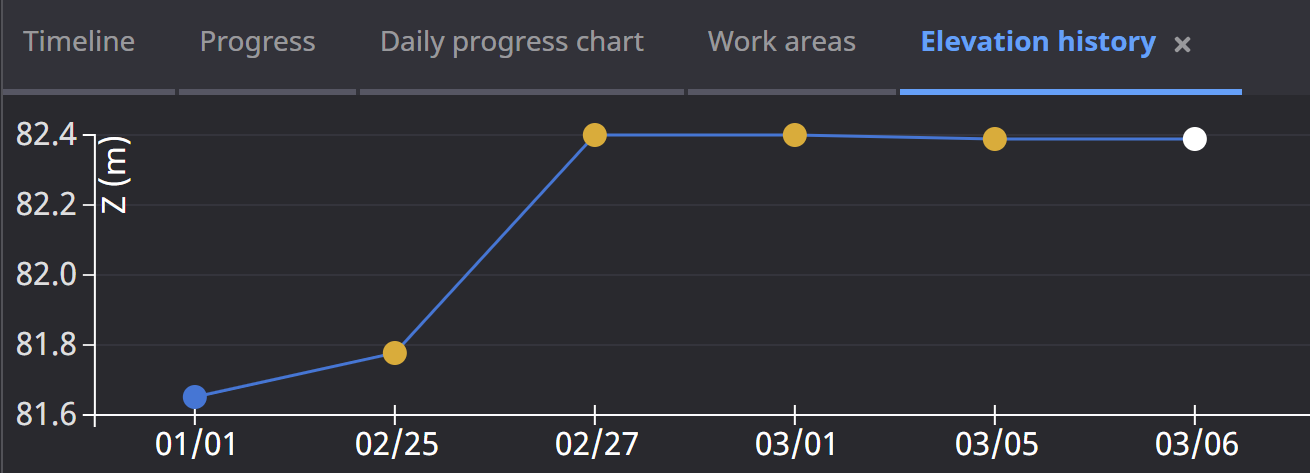
Elevation History Show a graph of elevation and slope data over time at a specific point.
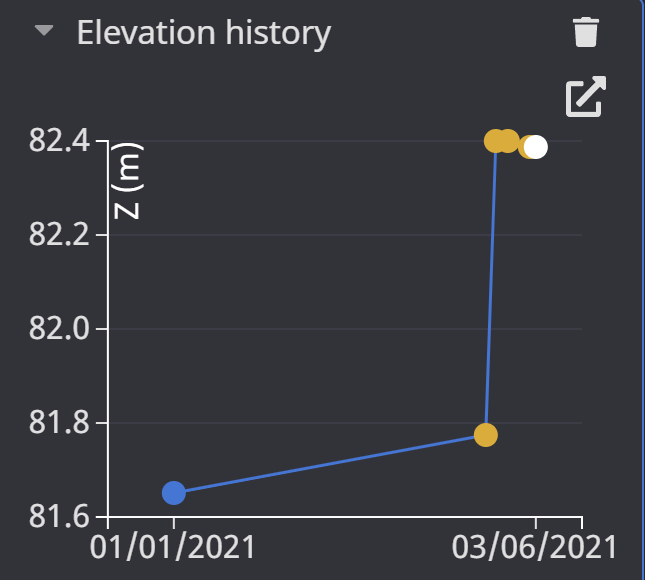
To pop out a chart, click the expand icon. This will open a tab in the footer.
Line measurements
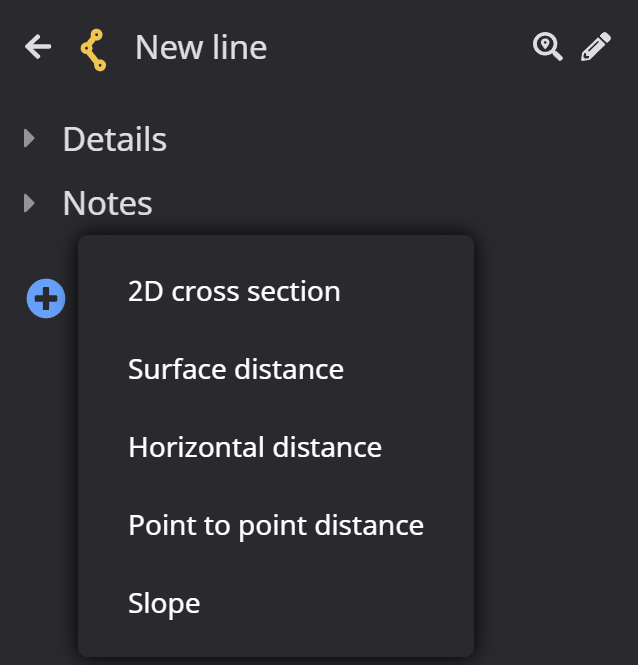
Go to the new line you created. Select Add new measurement. You may select one of the options below: 2D cross section, Surface distance, and Horizontal distance, Point to point distance, and Slope. Go to the Line placemark you created and select Add new measurement - 2D Cross Section.

2D Cross Section Create a graph of the cross section of survey data or designs along this line. A line graph will display with the cross section data of your Line placemark. To pop out a chart, click the expand icon. This will open a tab in the footer. In the footer, click Add to select additional datasets for analysis. Click the remove icon to delete it from the chart.
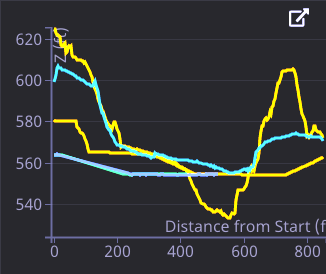
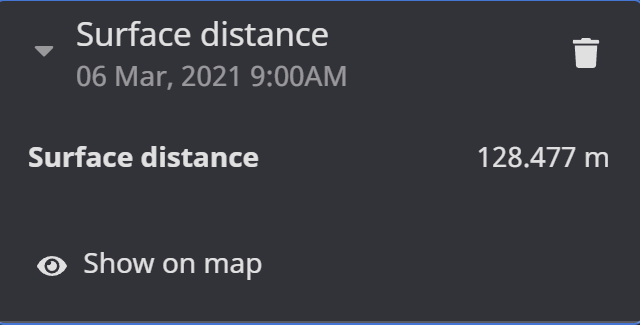
Surface Distance Measure the distance along a surface including differences in surface elevation over the selected region for survey data or a design model.
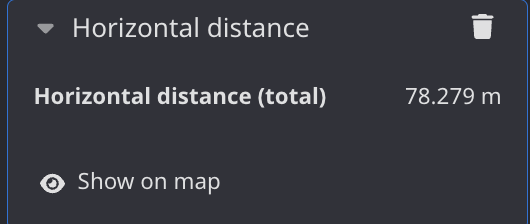
Horizontal Distance Measure the total distance of the line from endpoint to endpoint.
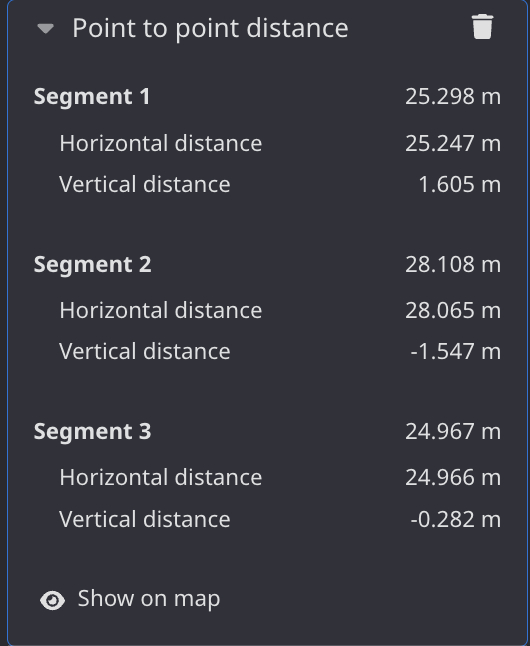
Point to Point Distance Measure the individual distance for each segment of the line from point to point.
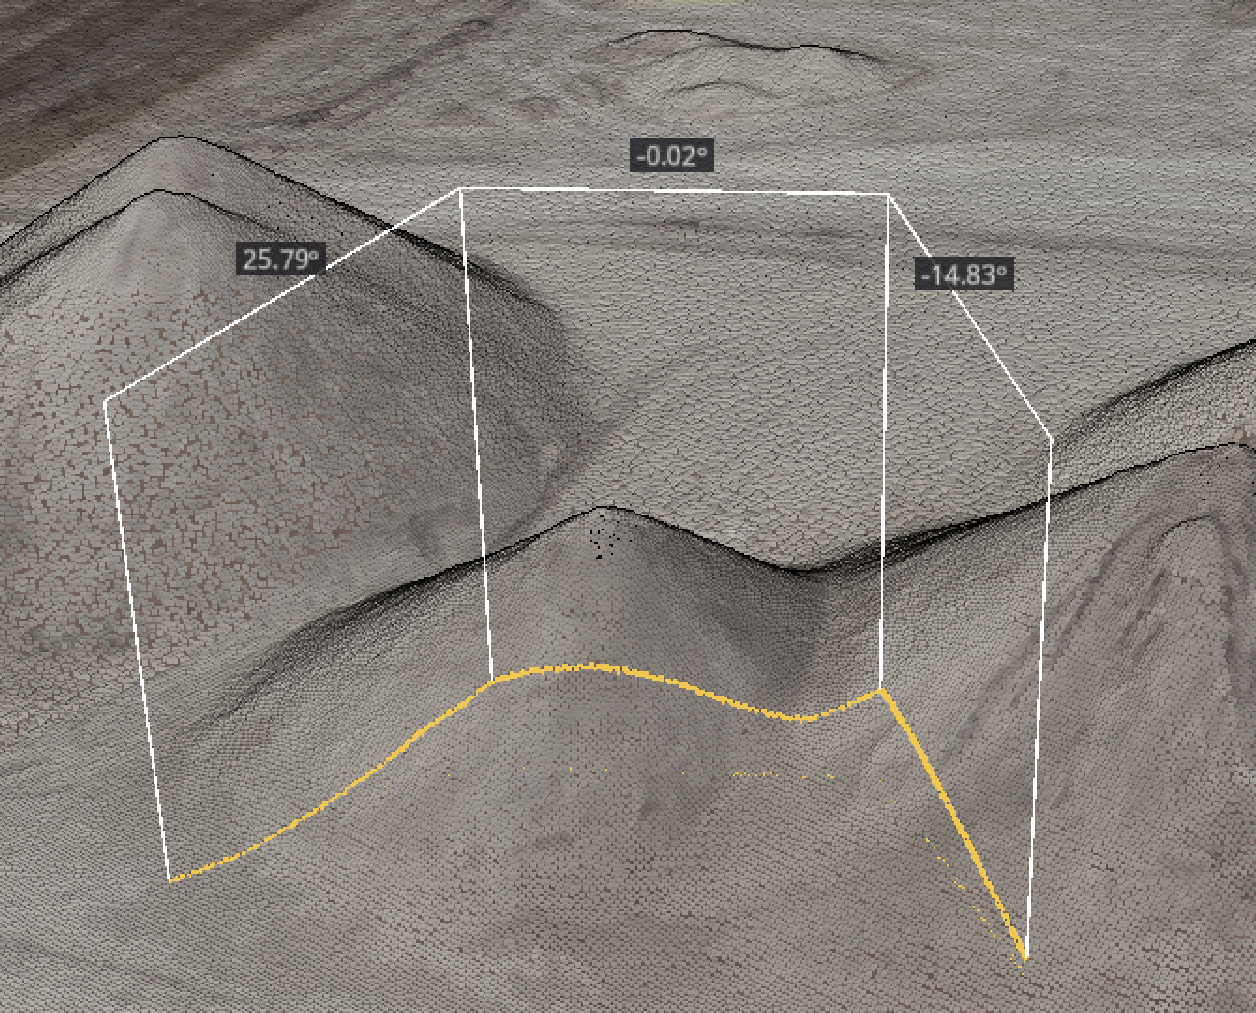
Slope Measure the slope (%) for each line segment of the line from point to point.
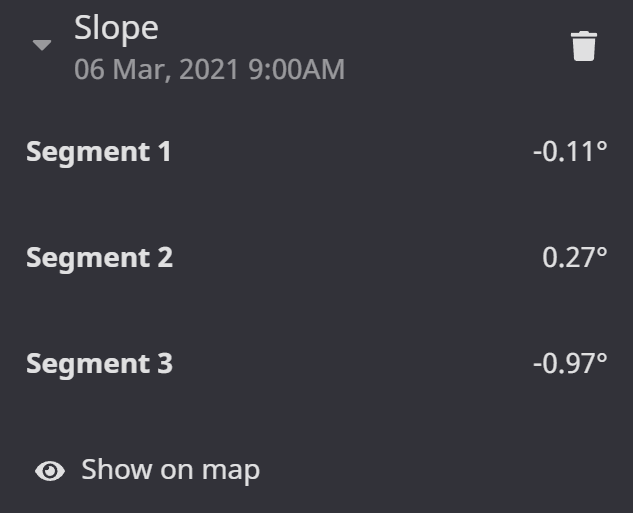
Map View Line measurements - slope, surface distance, horizontal distance, and point to point distance - are displayed in the map view. This can be toggled on/off with the Show on map option within each measurement.
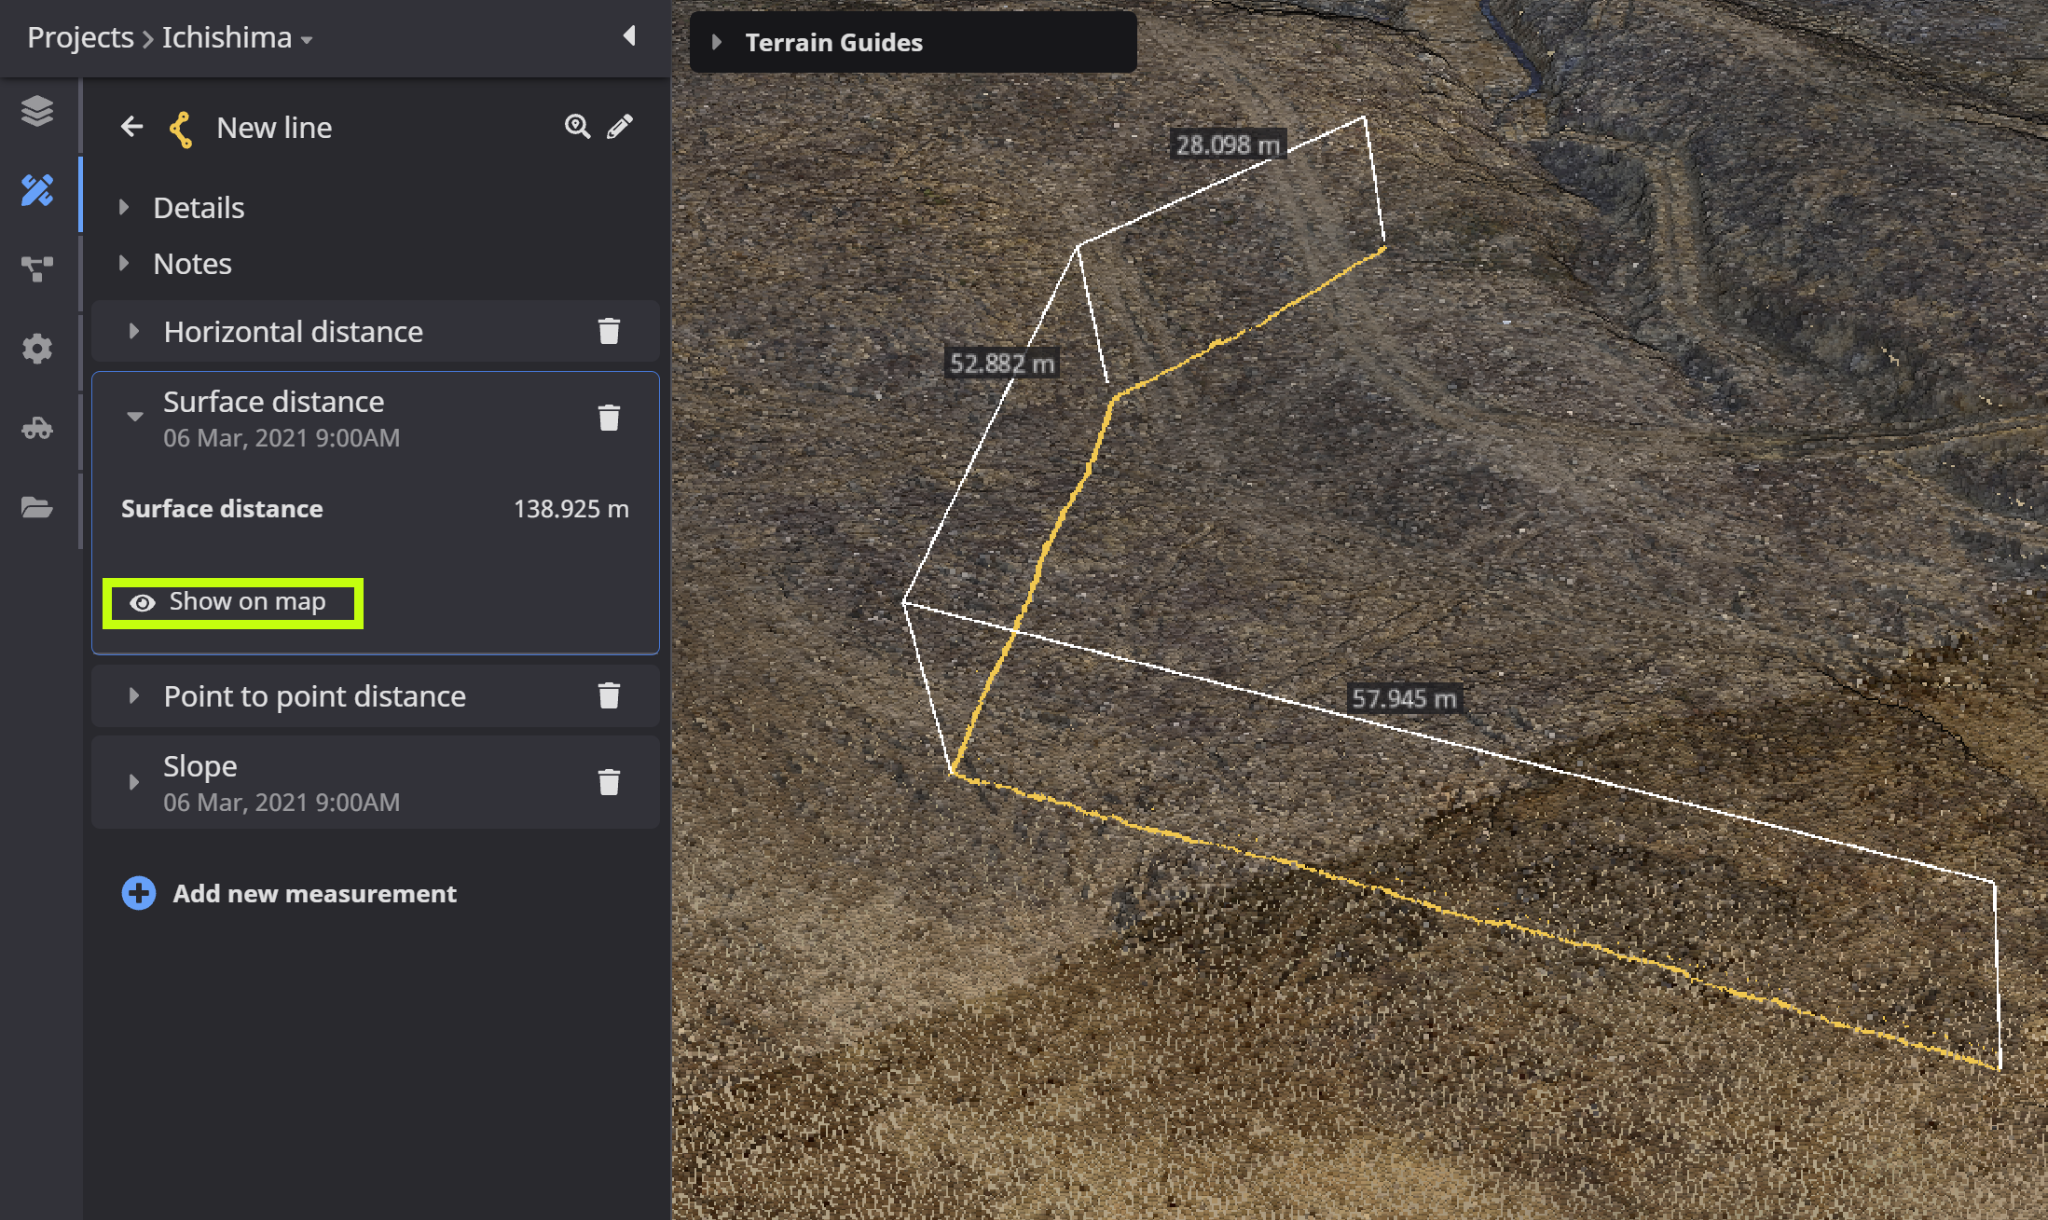
Slope measurements show the angle of each line segment, while distance measurements show the length of each line segment.
Polygon measurements
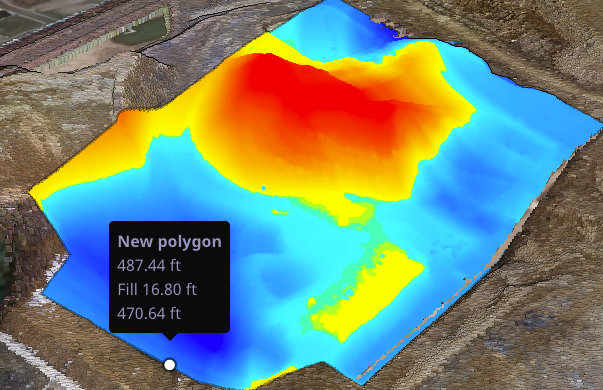
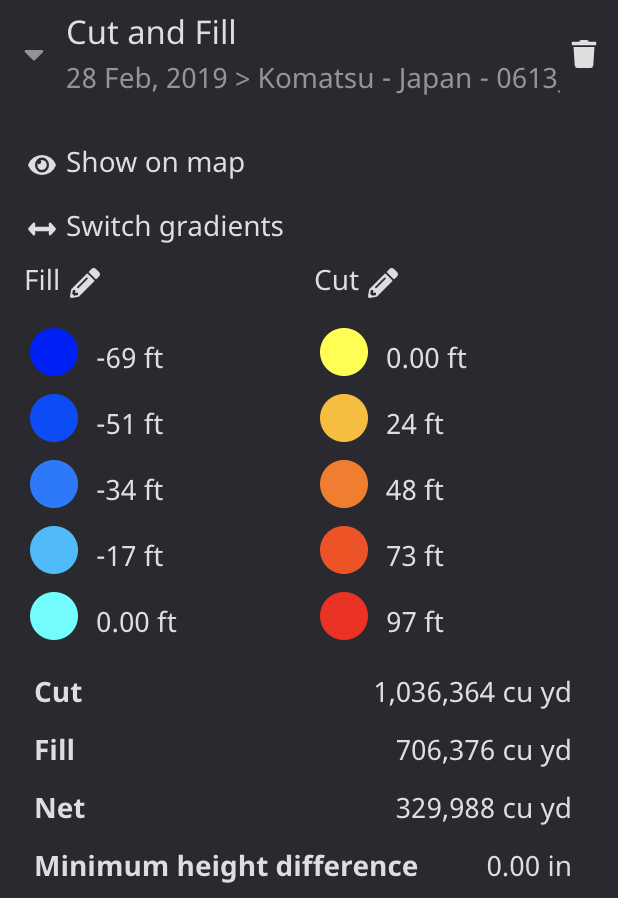
Cut and Fill Calculate cut and fill volume inside the selected area comparing two surfaces. Go to the Polygon placemark you created. Click Add measurement and select Cut and Fill from the drop-down options.
Cut and Fill Edit the heatmap colors and scale by clicking the edit icon. Toggle the heatmap display in the 3D View on and off by clicking the eye icon.
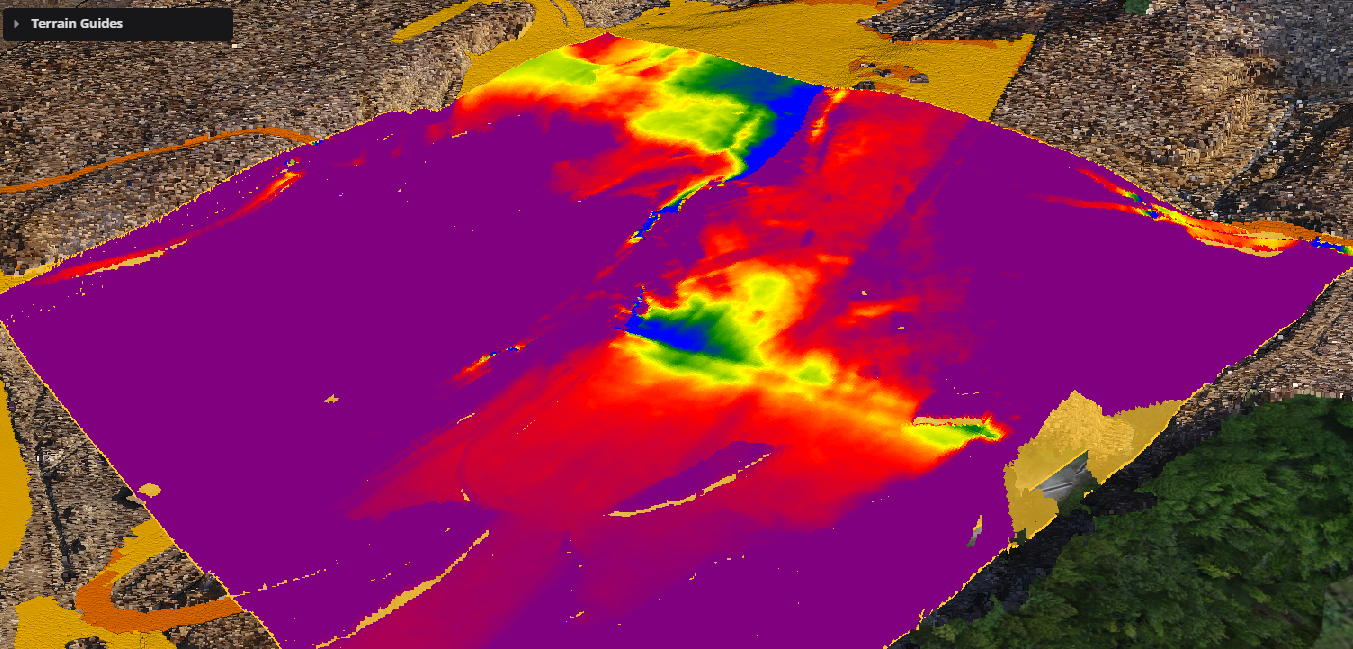
Progress Go to the Polygon placemark you created. Click Add measurement and select Progress. Calculate the percentage of progress completed from the initial surface to a target design inside the selected area. Progress is computed based on the current volume of cut and fill and the total cut and fill volume. Choose to display a Heatmap or Classification (categorized areas). Edit the heatmap or classification colors and scale by clicking the edit icon.
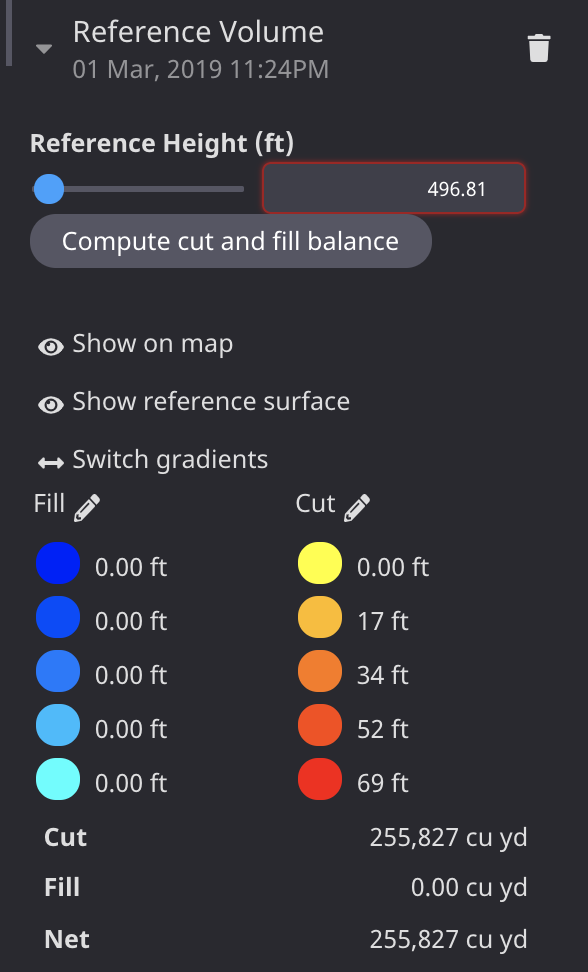
Reference Volume Calculate the cut and fill volume for survey data or a design model. Choose a precise reference height to act as the base level of the volume being measured. Go to the Polygon placemark you created. Click Add measurement and select Reference Volume. Adjust the height of the base by adjusting the Reference Height value. To select a height that balances Cut and Fill amounts, click Compute cut and fill balance. Edit the heatmap or classification colors and scale by clicking the edit icon.
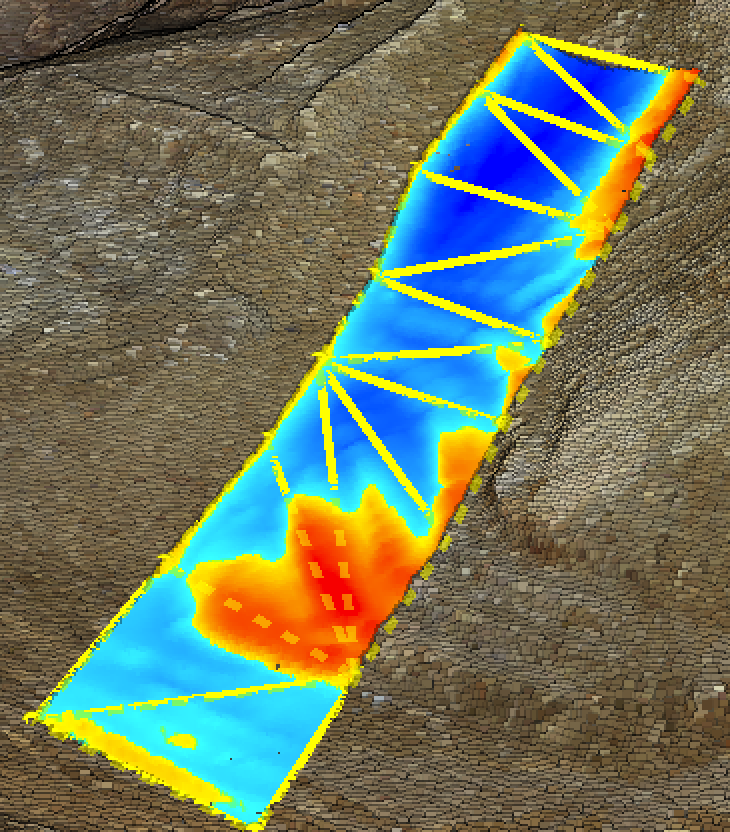
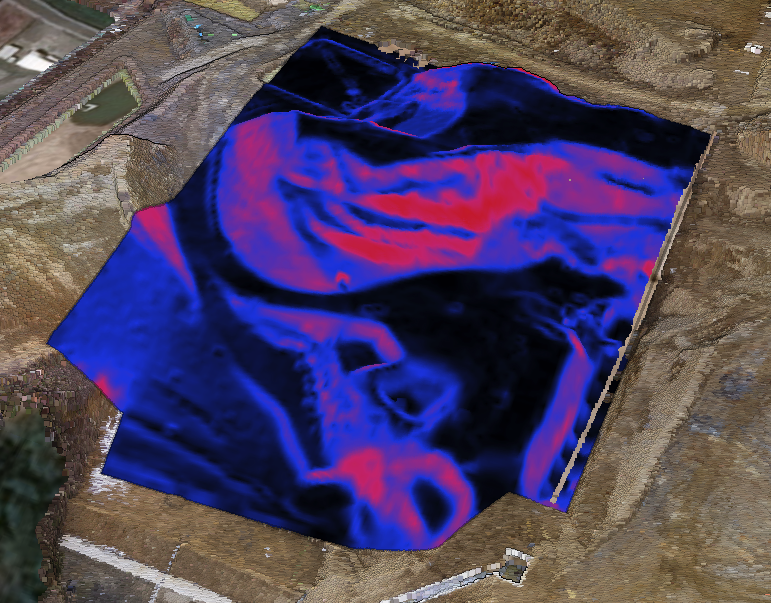
Smart Volume Calculate the cut and fill volume for survey data or a design model. Smart Volume estimates the ground level from the features inside the selected area. Go to the Polygon placemark you created. Click Add measurement and select Smart Volume. Edit the heatmap or classification colors and scale by clicking the edit icon.
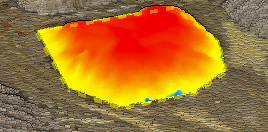
Click Show reference surface to toggle the TIN surface or mesh used to calculate the volume.

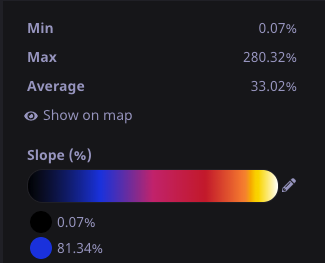
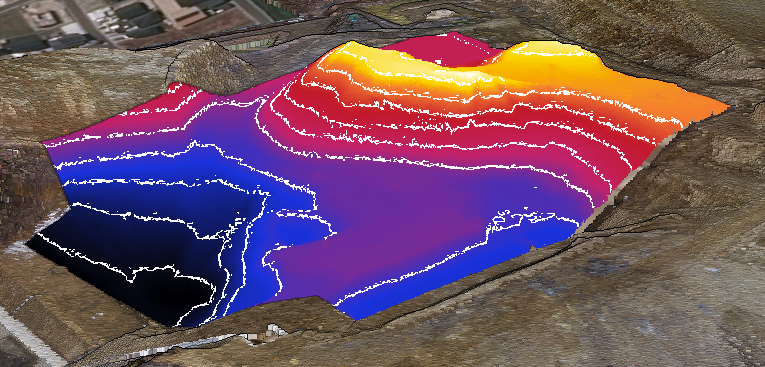
Slope Add a heatmap in the 3D View to measure the slope over the selected region for survey data or a design in this area. Go to the Polygon placemark you created. Click Add measurement and select Slope. Edit the heatmap or classification colors and scale by clicking the edit icon.
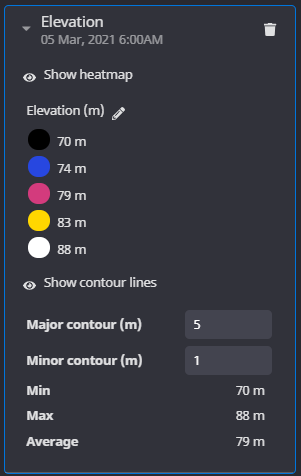
Elevation Add a heatmap in the 3D View to measure the elevation over the selected region for survey data or a design. Measure the minimum and maximum elevation over the selected region. Go to the Polygon placemark you created. Click Add measurement and select Elevation. Edit the heatmap or classification colors and scale by clicking the edit icon. Display contour lines in the 3D View by clicking the Show contour lines icon. Adjust the Contour interval value to change the height between contour lines.
Surface Area Measure the area of the volume, including differences in surface elevation over the selected region for survey data or a design model.
Go to the Polygon placemark you created. Click Add measurement and select Surface Area.

Horizontal Area Measure the area of a selected region as a flat plane.
Go to the Polygon placemark you created. Click Add measurement and select Horizontal Area.
Site
Some polygon measurement tools can be added to the entire site, including Cut and Fill, Progress, Slope, and Elevation measurements.
When using Site measurements, the measurement results are clipped to the extent of the current Target Design.
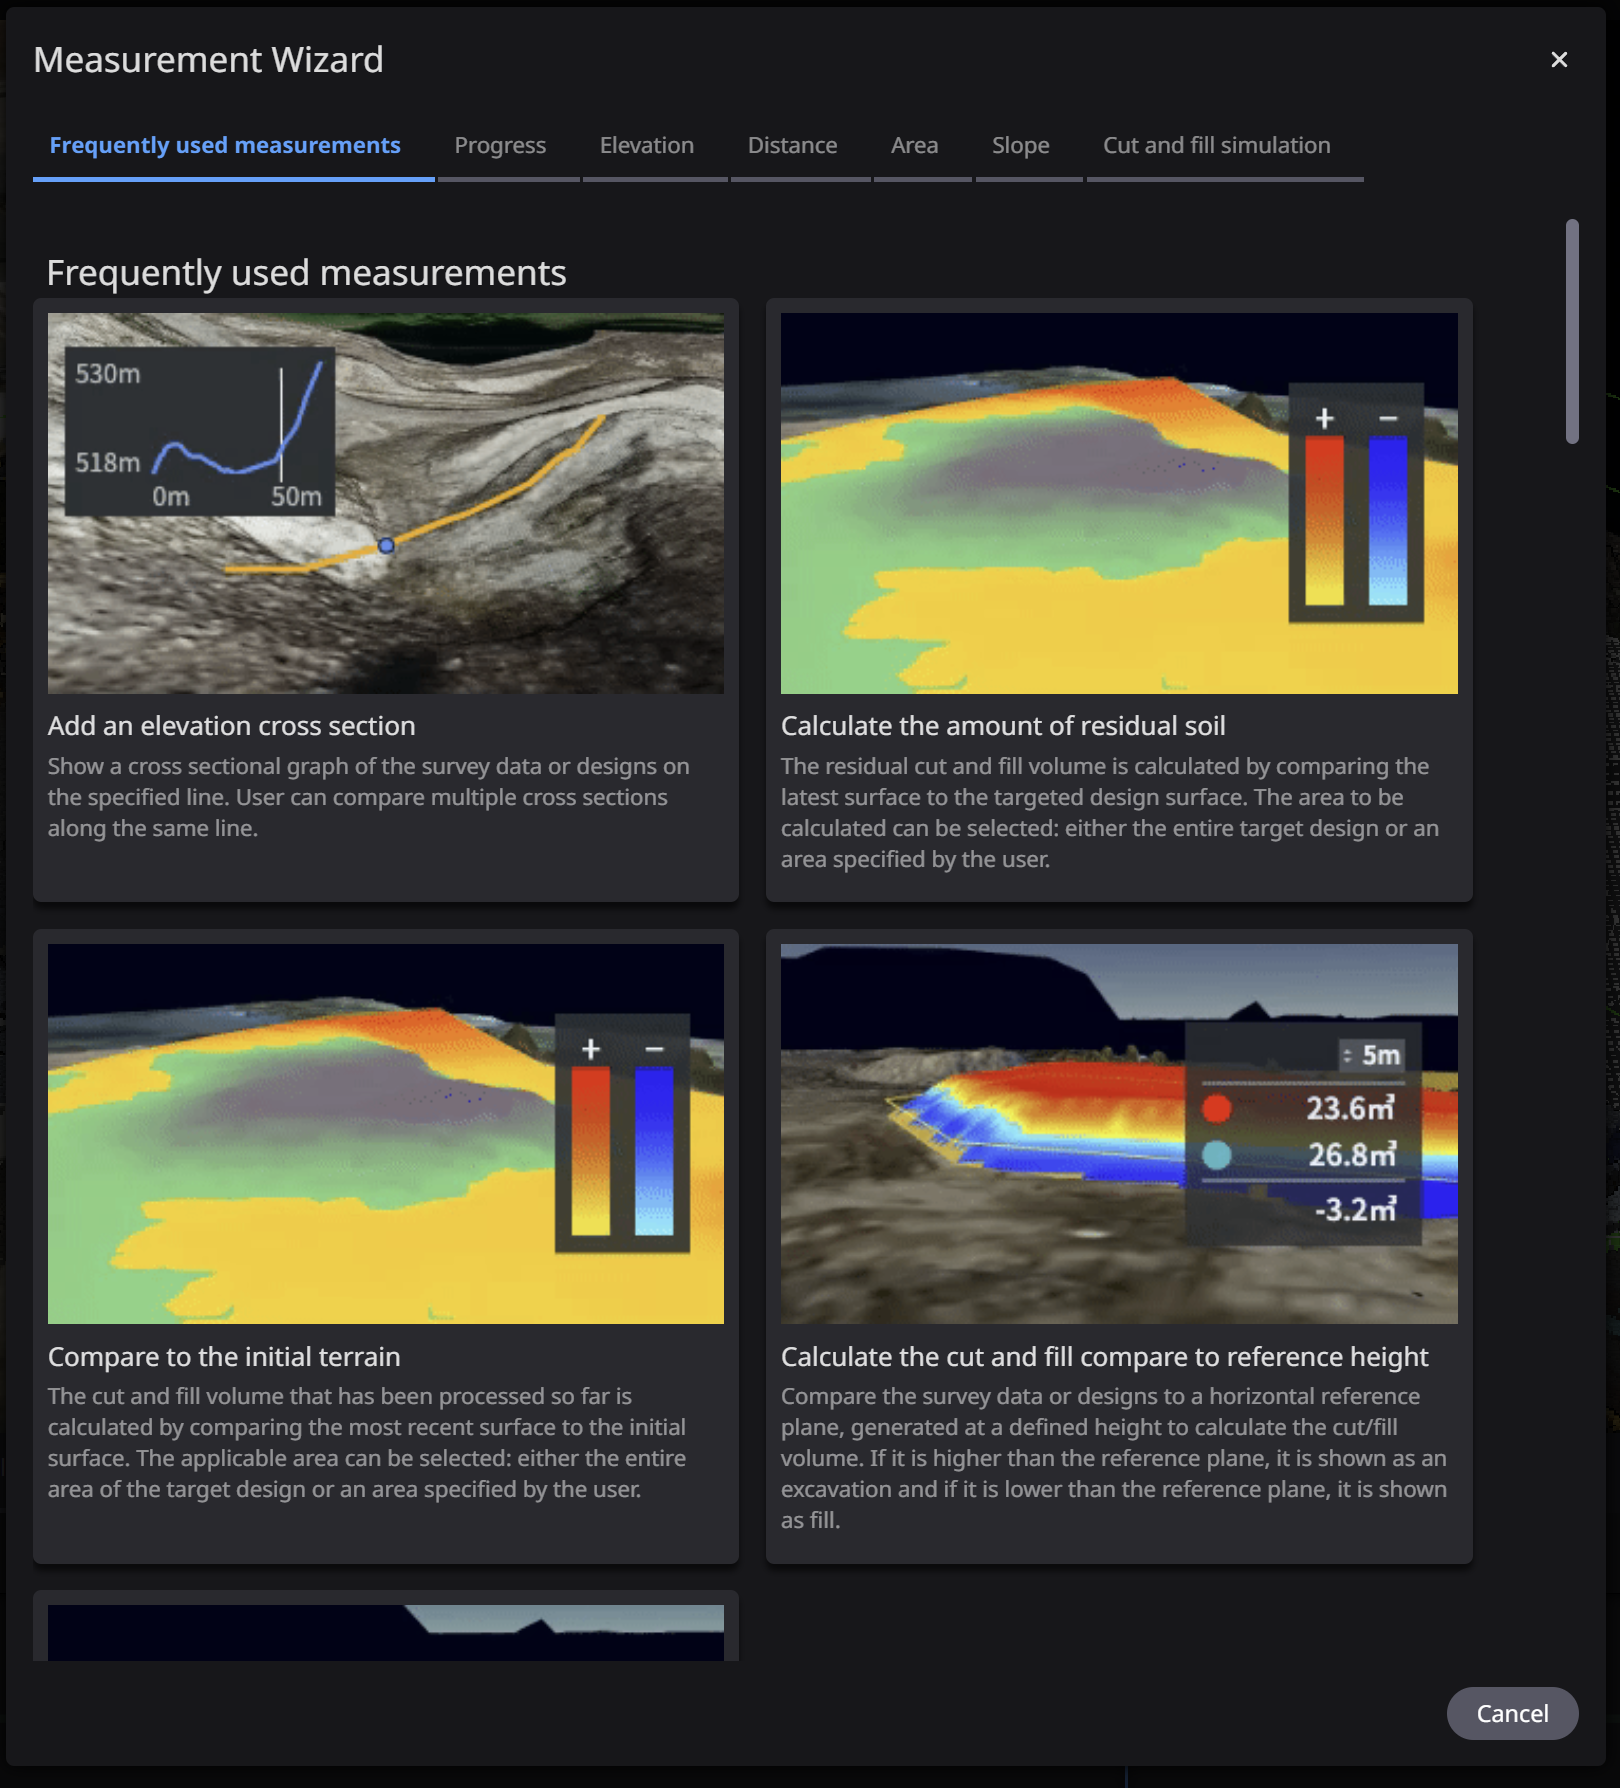
Measurement Wizard
Materials
For line and area measurements, you can define material information to include Density and Unit Costs. You can material information for both Volume and Area calculations.
When working with measurement types, you can select from one of the user defined material types to calculate weight and costs for a specific measurement.
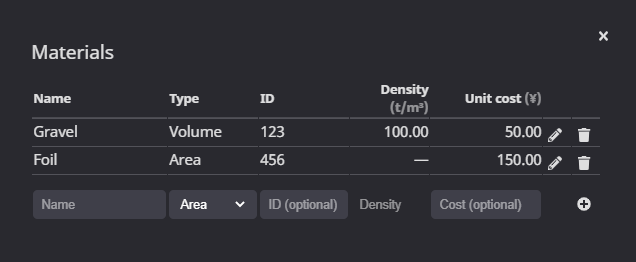
Create and edit materials
Within the Measurements view, expand the Material section. To edit the list of materials and their properties, click the Edit materials icon. This will open the Materials menu.
To add a new material enter Name Type – Select either Area or Volume Optional ID Density – Only for area types Unit Cost Click the add icon to add it to the list.
To edit a material, press the Edit icon, modify any values, and click the confirm icon

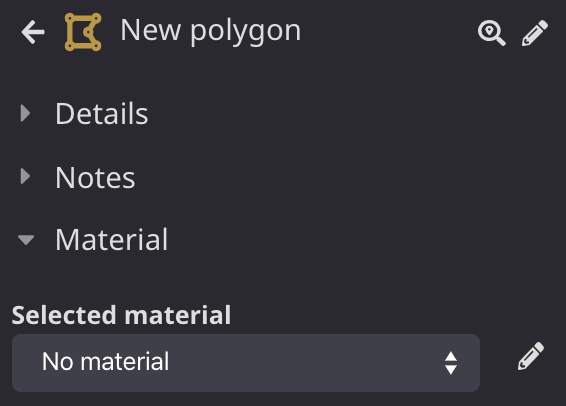
Materials and measurements
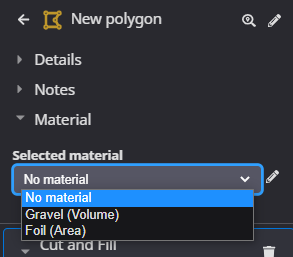
Within the Measurements view, expand the Material section. Under Selected material, select one of the types that have been added to this project.
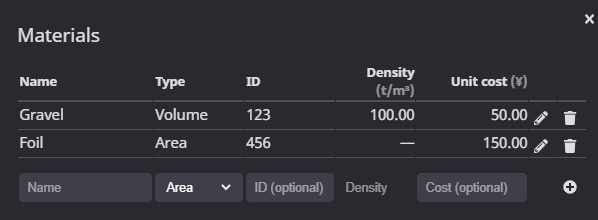
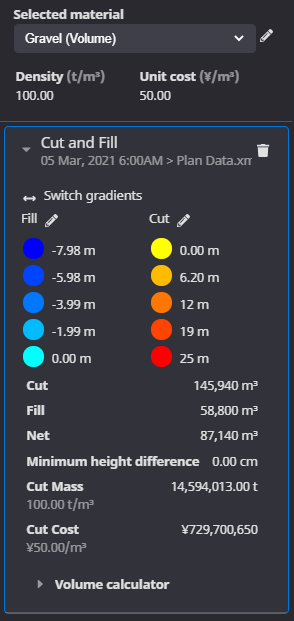
When selecting a volume-based material, in this example Gravel, the density and unit cost information can be added to existing volume based measurements. This includes the following measurements: ● Cut and Fill ● Reference Volume ● Smart Volume The mass and cost values are added to the existing measurement results.
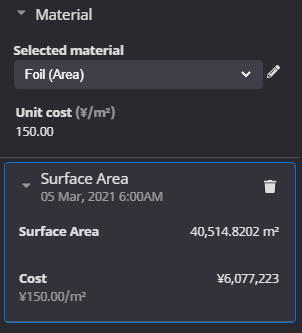
When selecting an area-based material, in this example Foil, the unit cost information can be added to existing area-based measurements. This includes the following measurements: ● Surface Area ● Horizontal Area The mass and cost values are added to the existing measurement results.
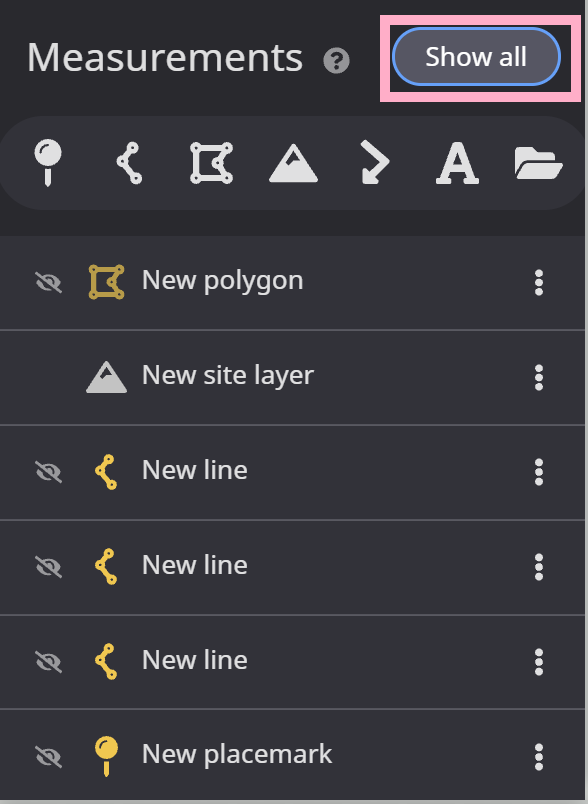
Measurement visibility
The visibility of measurements can be toggled individually by clicking the eye icons.
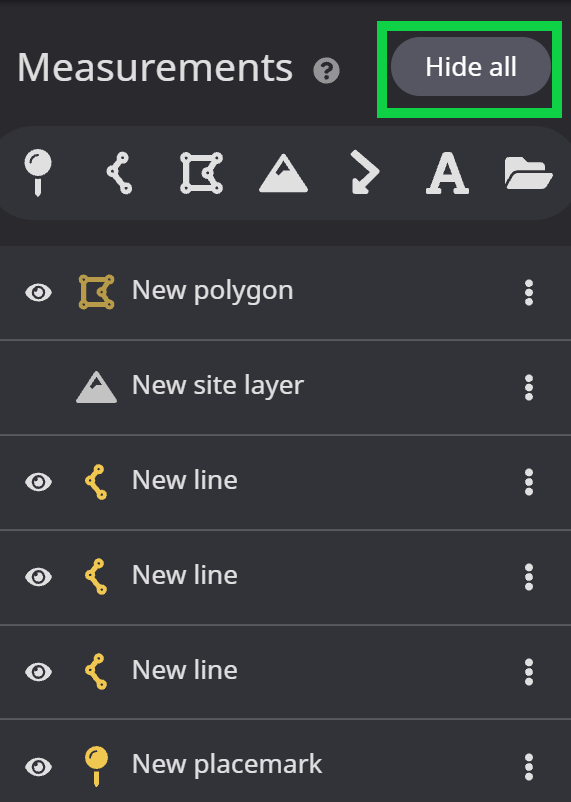
Measurement visibility can also be turned on or off in bulk by using the show all / hide all button.
After clicking “Hide all”, the visibility icons for each measurement switch to off.
After clicking “Show all”, all measurements will be visible again.
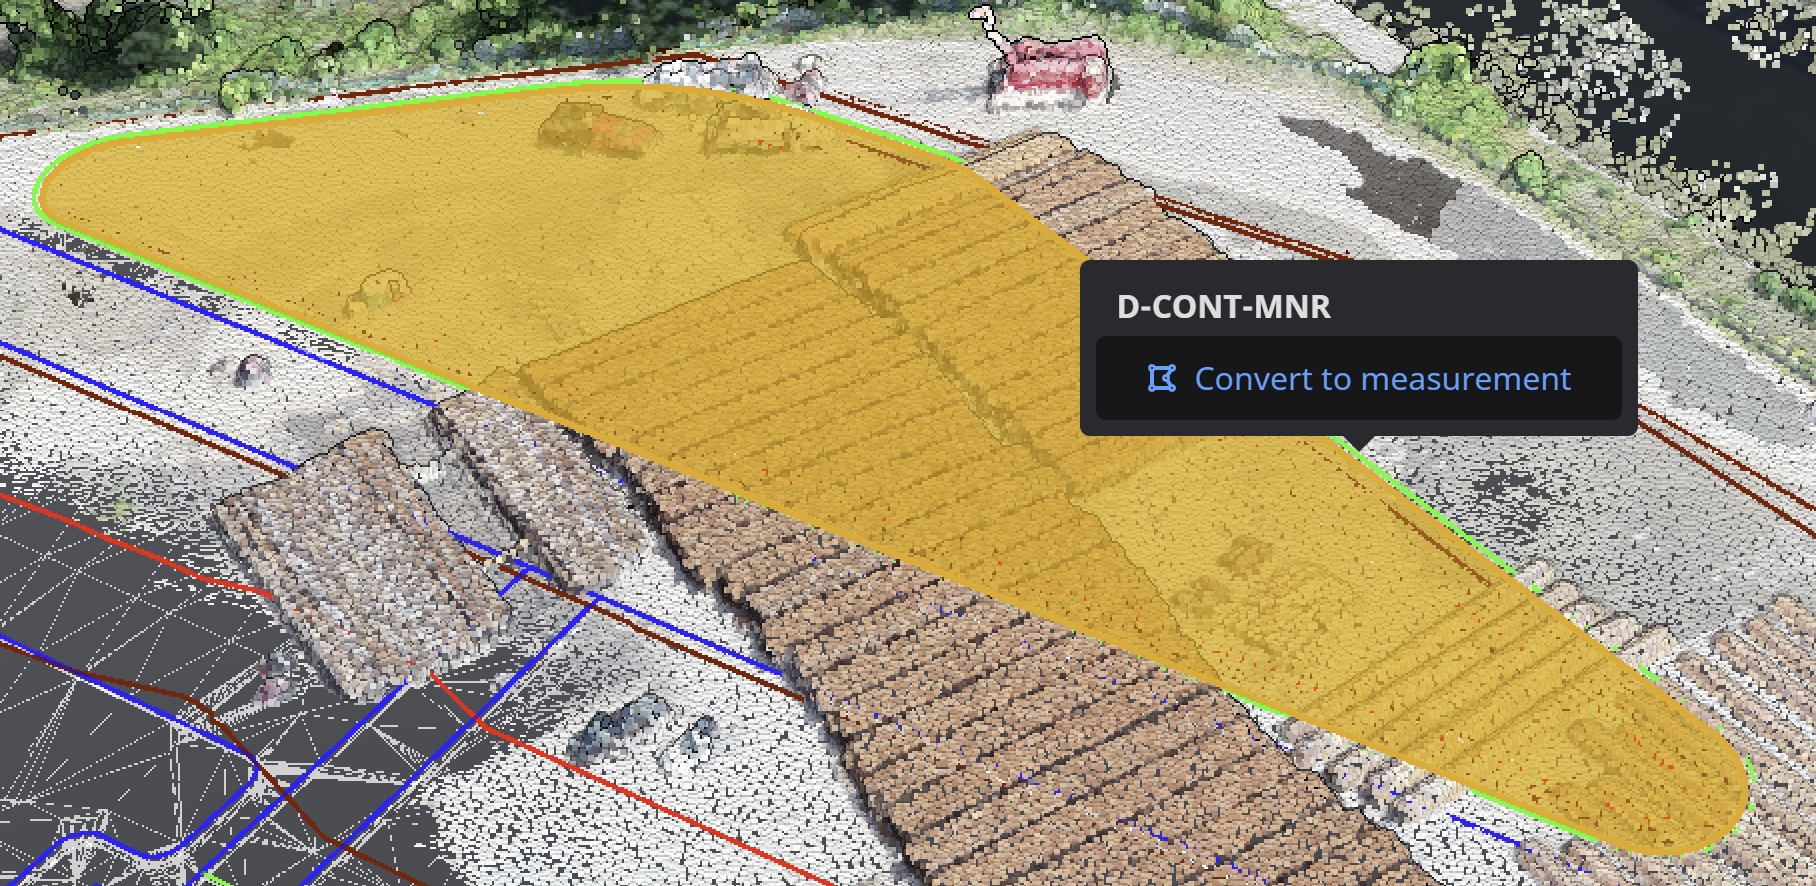
Convert linework to measurement
By clicking on design linework, you can convert to either a polygon measurement or a line measurement.
To convert to polygon measurement, click the linework in a closed polygon, and “Convert to measurement” will pop up along with the polygon icon.
Once clicking Convert to measurement, the measurement will open in the side panel.
You can now click Add measurement and select from the drop-down options.
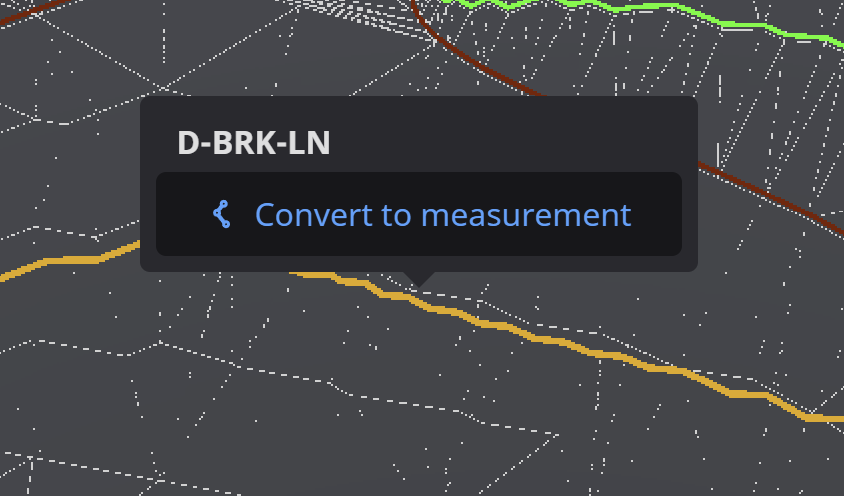
To convert to line measurement, click any section of linework, and Convert to measurement will pop up along with the line icon.
Once clicking Convert to measurement, the measurement will open in the side panel.
You can now click Add measurement and select from the drop-down options.

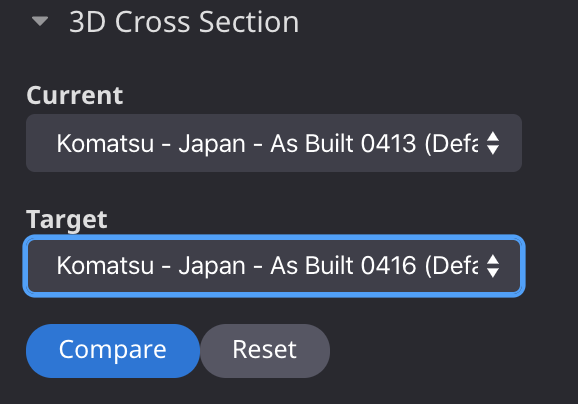
Inspect the jobsite with a 3D cross section
Open the Measurements tab in the side panel and open the 3D Cross Section panel.
Select two different surfaces to compare and click Compare.
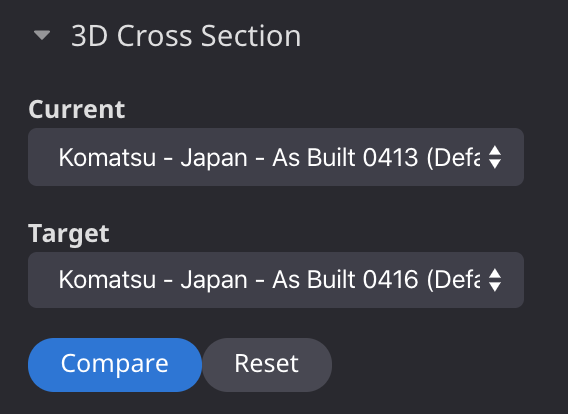
In the 3D View, a plane will appear between the two surfaces. Click and drag to compare the surfaces.
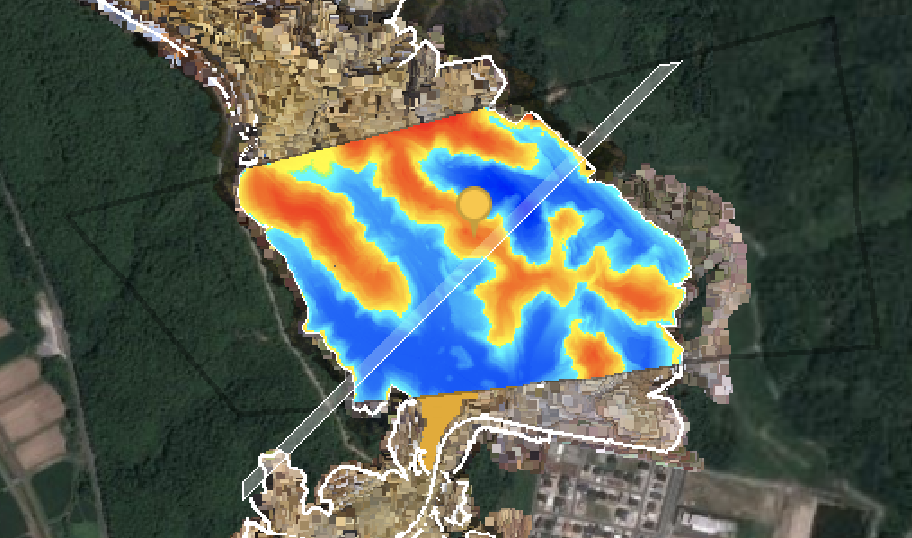
To reset the 3D View, click Reset.
Project Settings
The Project settings panel provides access to a number of options for managing the jobsite.
- Jobsite Info – Details on the jobsite including Name, Jobsite ID, Status, etc.
- Coordinate System – Details on the jobsite projection type, latitude, longitude, etc.
- Data – Options for controlling daily As Built sync.
- Units – Details on job site units including distance, areas, volume units.
- Display – Options for Resolution and display site image.
- Site Members – List of site members and access levels.
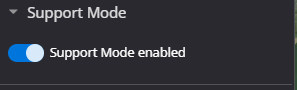
- Support Mode – Option for turning support mode on and off.
- Delete project – Deletes the current project.
Jobsite Info
Jobsite info displays details on the jobsite. The information displayed in the Jobsite Infor panel is maintained within Smart Construction’s Jobsite Manager. You can turn on/off Daylight savings time.
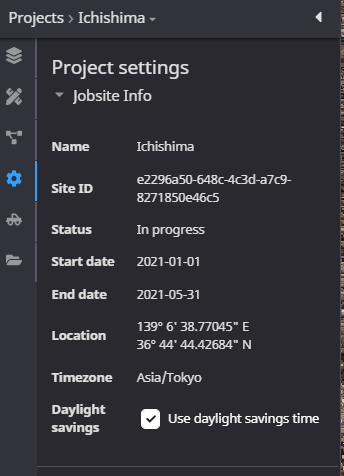
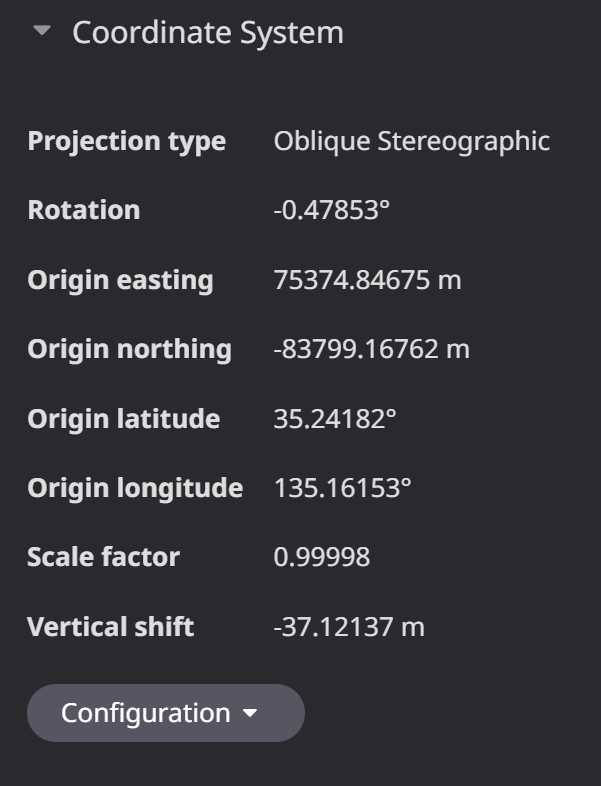
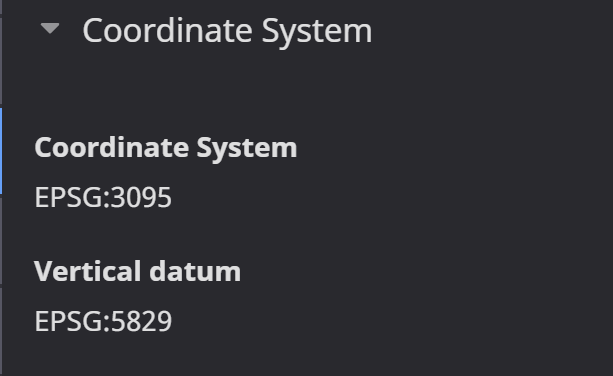
Coordinate System
A coordinate reference system (CRS) is used to define how and where data is projected on the map view. The coordinate system display will differ based on whether the user uploaded a localization file to define the project CRS (left), or whether they defined it manually (right).
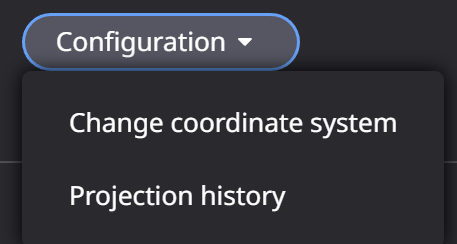
Configuration
The user can Change coordinate system of a project by going to Coordinate system > Configuration > Change coordinate system.
The coordinate system dialogue box that is available when the user creates a project will appear.
The user can change a localization file, switch to a manually selected CRS, or vice versa.
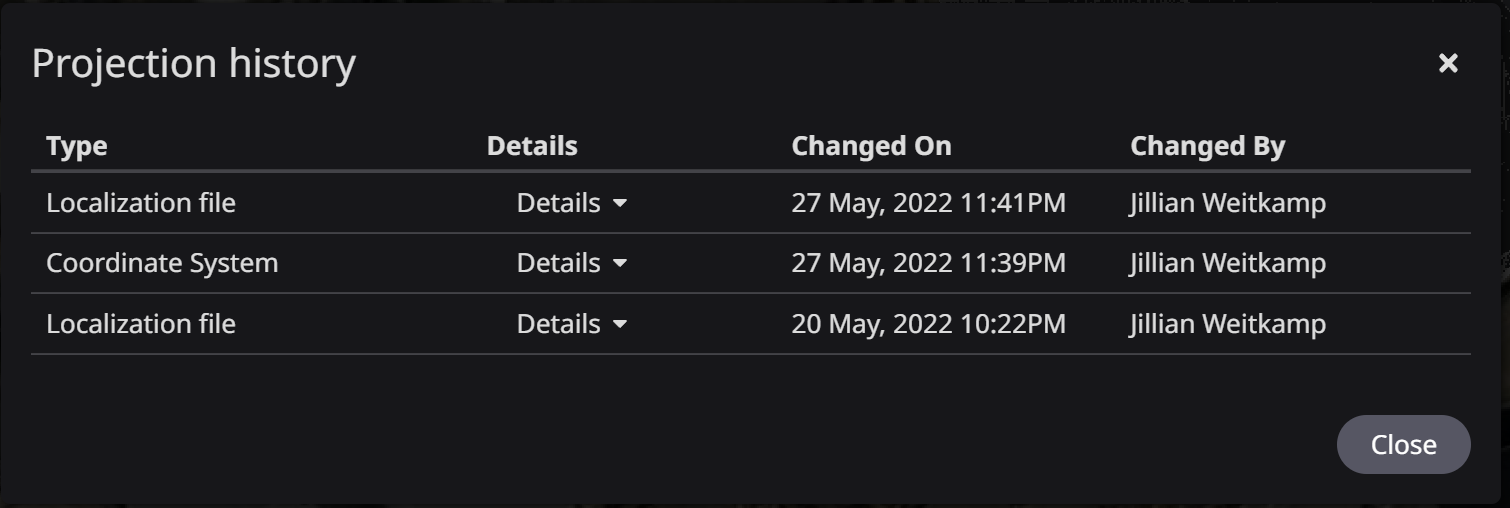
Projection history can be viewed in Coordinate system > Configuration > Projection history. Details are available for each.
If a Localization file is used, it will show on the data layers panel below the design layer section. If a CRS is manually chosen, this will not appear in the side panel.
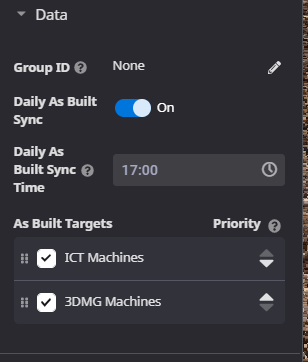
Data
The Data view provides options to manage the Daily As Built Sync services for the jobsite:
- Group ID - The organization's group ID to use when importing data from Smart Construction Drone.
- Daily As Built Sync - If Daily As Built Sync is turned on, at this time every day SC Dashboard will automatically sync data for the previous 24 hours from on-site machines. A target design and pre-construction survey is required, as well as available As Built data in the site area.
- As Built Targets - Determines which types of machines to check for data while performing the daily sync of As Built data for this site. A higher priority means the data from that type of machine will take precedence if overlapping data from another machine.
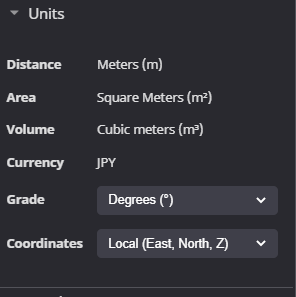
Units
The Units view displays the units set for the job site. The units are used for all measurement calculations and reports.
- Grade – Select the grade values used in the jobsite.
- Degrees ( ° )
- Grade ( % )
- Ratio ( : )
- Coordinates – Select the format of the coordinates displayed in the View:
- Local – East, North, Z
- Local – North, East, Z
- Global – Lat, Lon, Height
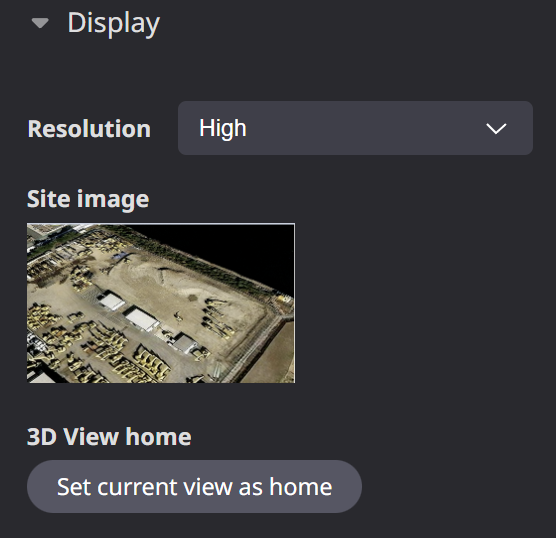
Display
The Display view provides an option to control the resolution of the terrain data in the display. You can select from Low, Medium, and High options.
The site image from the Smart Construction Jobsite Info is displayed as well.
3D View home allows the user to set the map display’s current view as home.
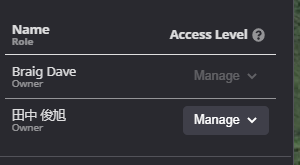
Site members
The Site members view displays a list of users that have access to the jobsite. In addition, information is displayed about each user’s access level to the jobsite is displayed.
The following access levels are available. See Access level details for more information
- Manage – Complete access to jobsite and all Dashboard functions.
- Measure – Can access, view, perform measurements and download jobsite data.
- View – Can access and view jobsite data and site progress information.
- None – Can access and view jobsite data only.
Access level details
| Permissions per Access Levels | Manage | Measure | View | None |
| Implement As Built re-acquisition* | ❌ | ❌ | ❌ | ❌ |
| Add/edit machine (global)** | ❌ | ❌ | ❌ | ❌ |
| Transfer to machine** | ❌ | ❌ | ❌ | ❌ |
| Manage user roles | ✅ | ❌ | ❌ | ❌ |
| Access Project (view data layers) | ✅ | ✅ | ✅ | ✅ |
| Add/edit/delete data layers | ✅ | ❌ | ❌ | ❌ |
| Download data | ✅ | ✅ | ❌ | ❌ |
| Access Files Panel (ie. download) | ✅ | ✅ | ❌ | ❌ |
| Access reports | ✅ | ✅ | ❌ | ❌ |
| Access Machines Panel | ✅ | ✅ | ❌ | ❌ |
| View measurements | ✅ | ✅ | ✅ | ❌ |
| Create/edit/delete annotation | ✅ | ✅ | ❌ | ❌ |
| Create/edit measurement | ✅ | ✅ | ❌ | ❌ |
| Confirm progress | ✅ | ✅ | ✅ | ❌ |
| View Daily progress | ✅ | ✅ | ❌ | ❌ |
| View work areas | ✅ | ✅ | ❌ | ❌ |
| Access Project Settings | ✅ | ✅ | ❌ | ❌ |
| Delete Project | ✅ | ❌ | ❌ | ❌ |
| Toggle support mode | ✅ | ❌ | ❌ | ❌ |
- "Site Supervisor" can implement As Built re-acquisition only once a day.
- * Only "SuperAdmin" by Group Setting can add/edit machines and transfer file to machines regardless of other settings. For “Admin”, “Manager” and “Staff”, those functions are not displayed.
Support Mode
The Support Mode view allows you to control whether or not Komatsu Customer support accounts can access the site.
Delete Project
Use this option to Delete the project.
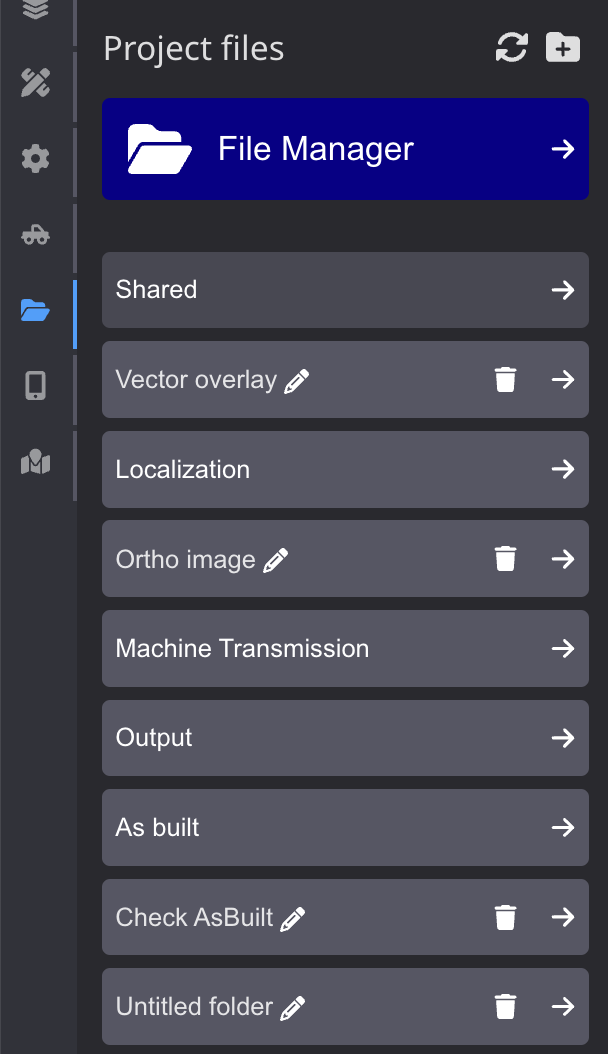
Project files
The Project file view allows you to view the various types of data added to the jobsite. You can also use the project files section to upload non-spatial data files to the project.
There are several default Project files folders on each jobsite
- File Manager - Open Smart Constructon File Manger
Project folder
- Shared – Shared project files
- Localization – Jobsite localization files
- Machine Transmission – Jobsite SL3 files
- Output – Report files
- As Built – Jobsite As Built data
- Vector overlay - Add CZML, GeoJSON, or KML
- Ortho image - Add ortho image
Smart Construction File Manager
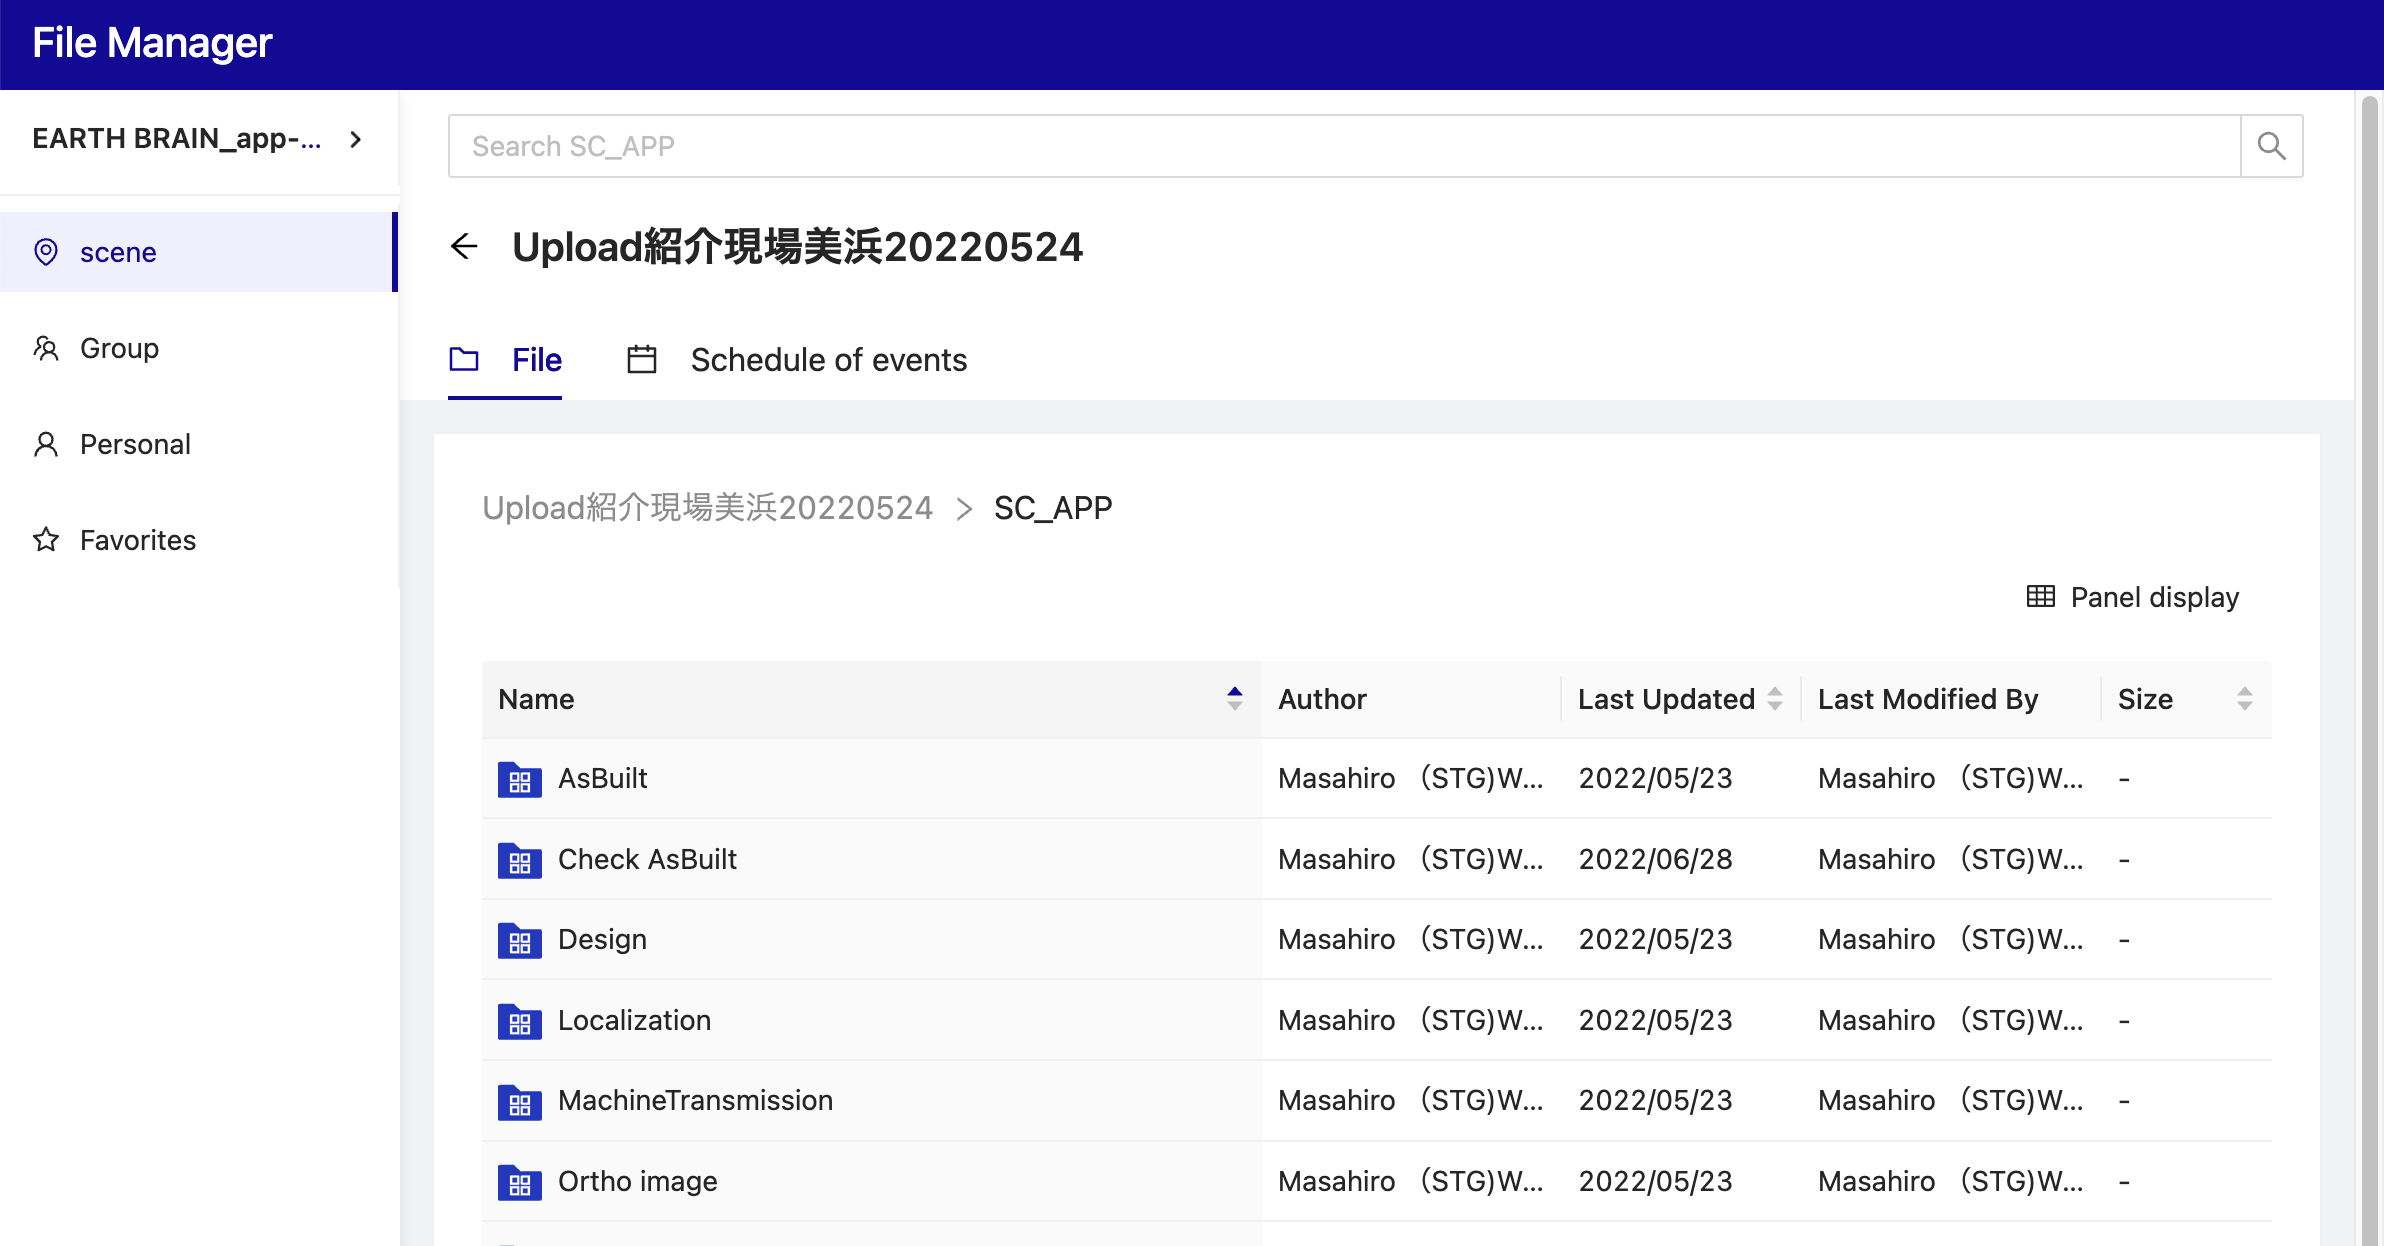
If you upload files here - they are not tiled or processed in any way. The files are just stored with the project.
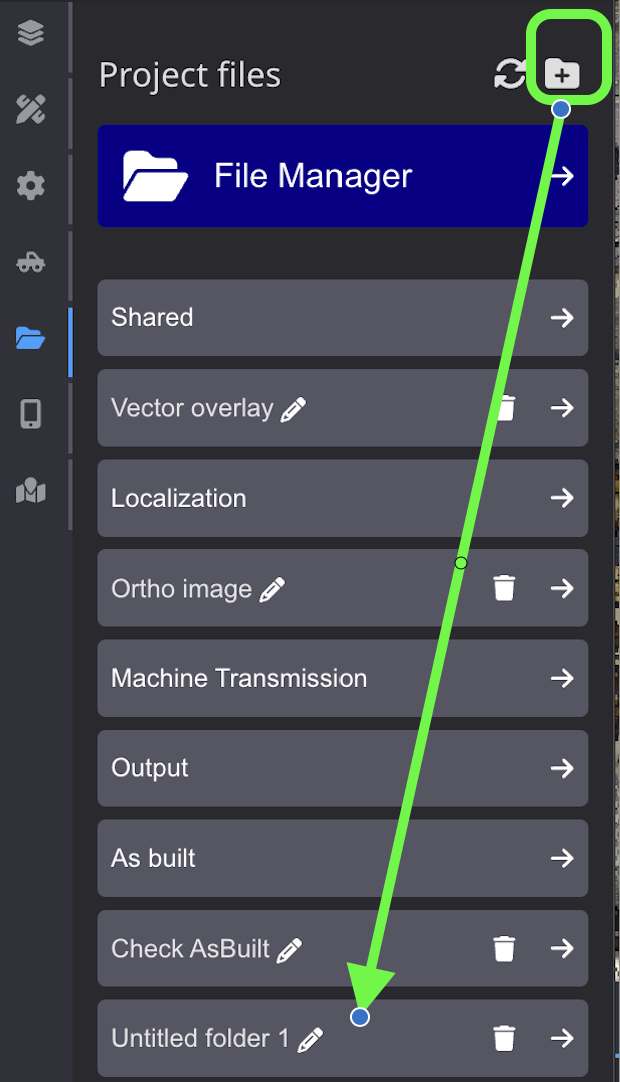
You can add your own project file folder by clicking on
Create user data folder
Click Add Folder Icon to create new folder. Name of newly created folder is “Untitled folder xx”
Edit folder name
Click pencil icon right next to Folder name to edit Folder name. Only user folder (which has pencil icon) can change its folder name.
Delete data folder
Click delete icon (Garbage bin icon) can delete the folder.(Only user folder can be deleted )
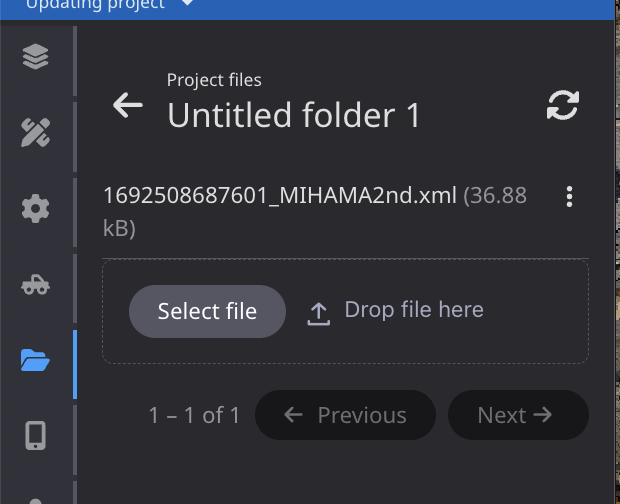
Store user files in the folder
Open user folder (which has pencil icon). and Drag&Drop or select file.
Once Upload file is completed, the file is shown in the file list.
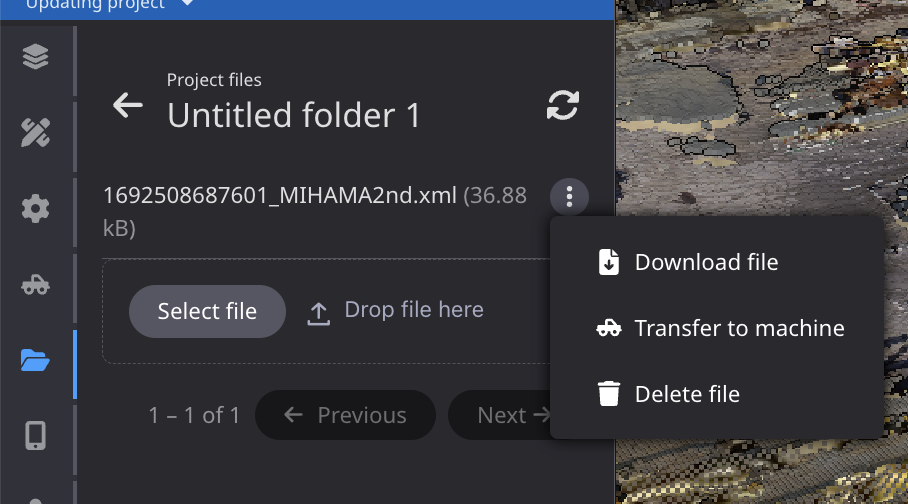
Download file
Select Download file to download the file to local device.
Delete file
Select Delete file to delete the file from folder.
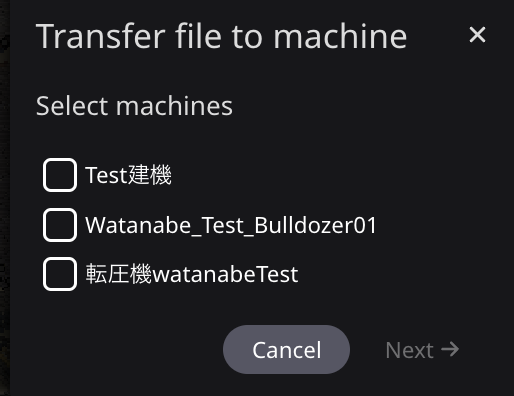
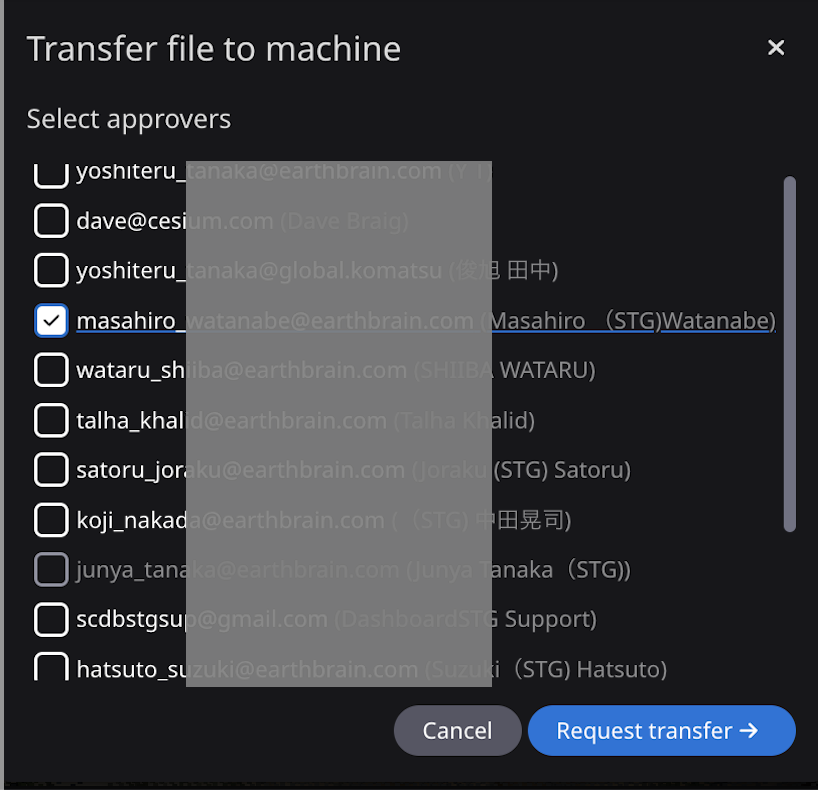
Transfer File to machine
User can send file to machine.
- SelectTransfer to machine item in the menu.
- Select machine from machine list
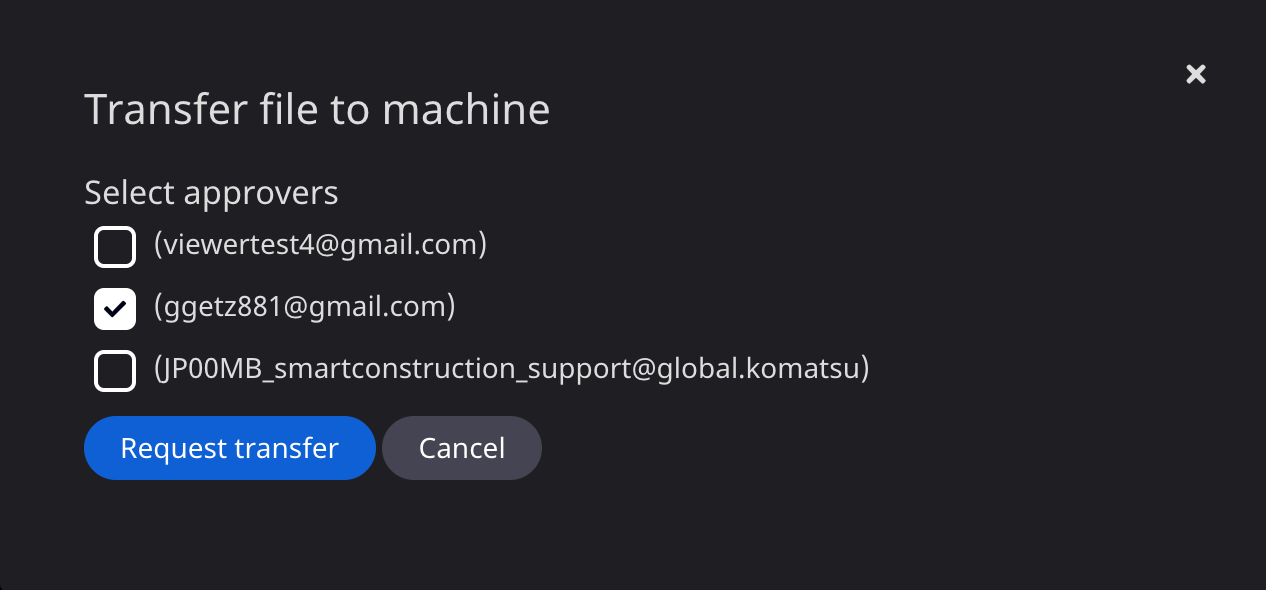
- Select approvers from the user list
- Click Request transfer button to transfer files.
Note
- the maximum file size of transfer to machine is 20MB.
- Available file types to transfer are as follows
- .sl3,.tp3,.tn3,.ln3,.bk3,.mx3,.rd3,.gd3,.pt3,.pl3,.gc3,.dxf,.dw
Generate reports for your jobsite
Measuring progress
Progress chart Use the Progress chart to see details on overall project completion compared to the final project. You must register a target design to your project, upload one initial survey, and import or upload at least one additional survey or As Built data layer to display the chart. The Progress chart is located at the bottom of the screen below the 3D map view.
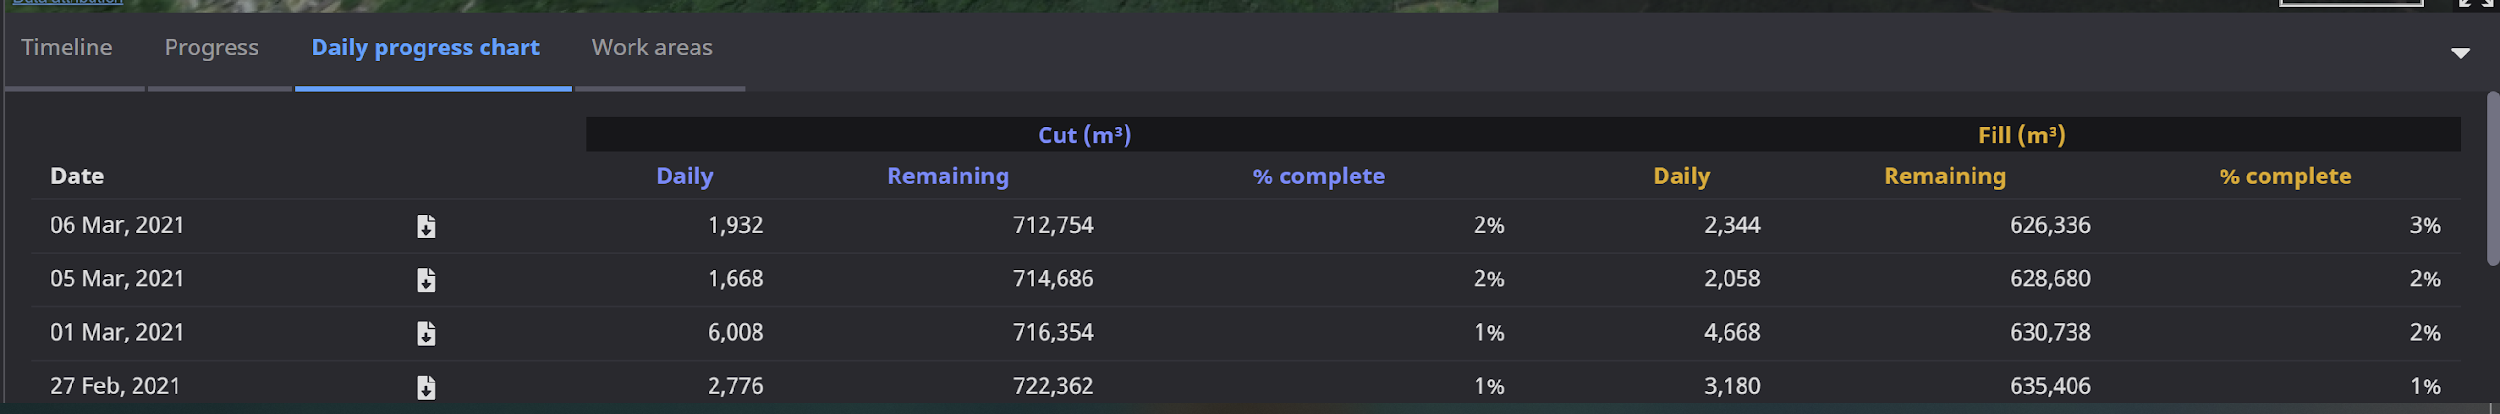
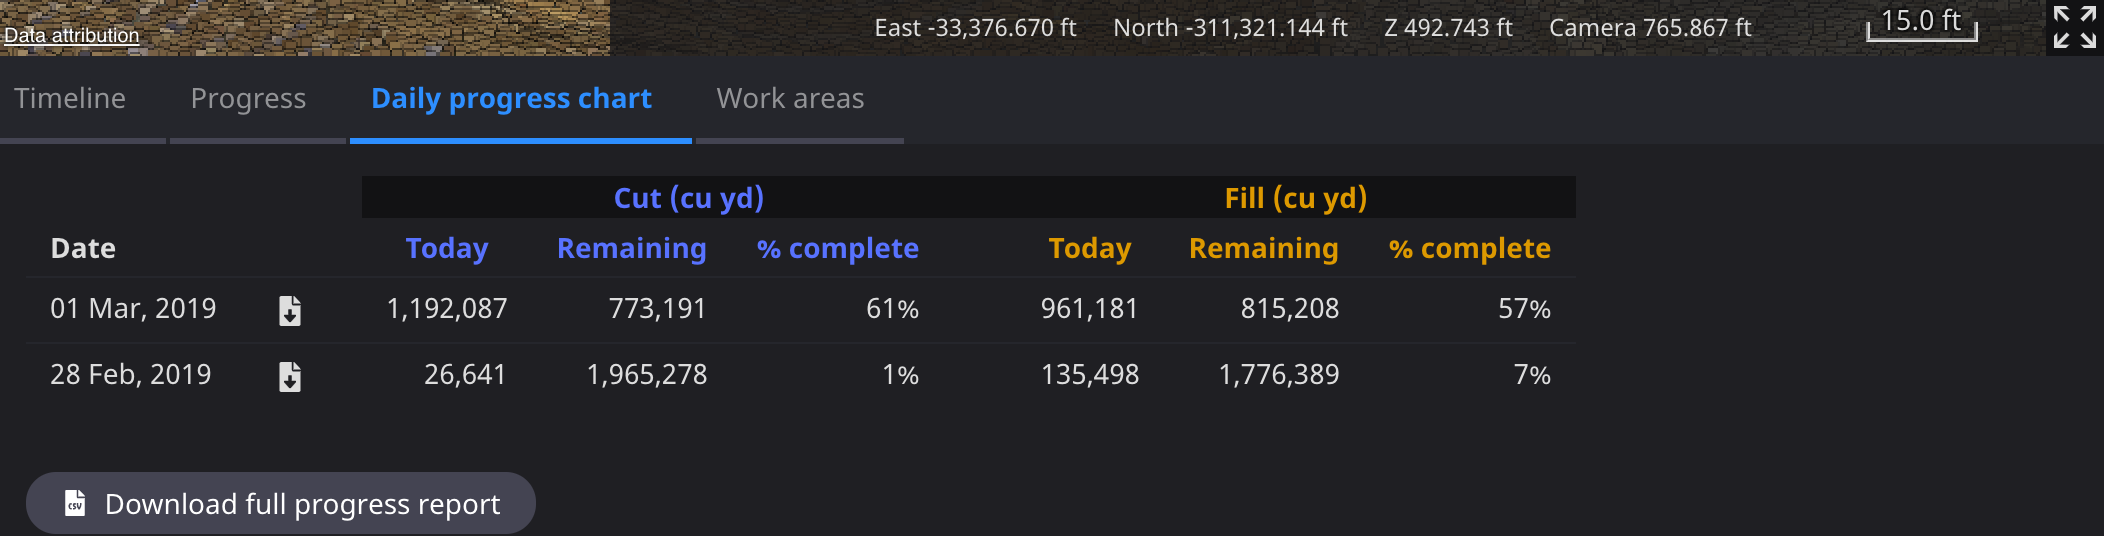
Daily progress Use the Daily progress chart to compare the project’s daily progress to the final design. You must upload the final design into your project in order to create a chart. A new entry will be created in the table for each day new data is available. As Built data, if available for the jobsite, will be updated everyday. To pull a full progress report as a CSV file, click Download full progress report at the bottom left of the Daily progress chart bar.

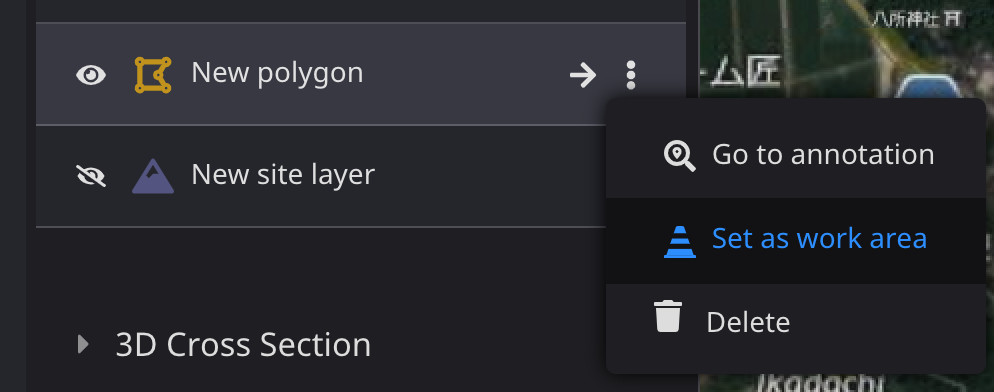
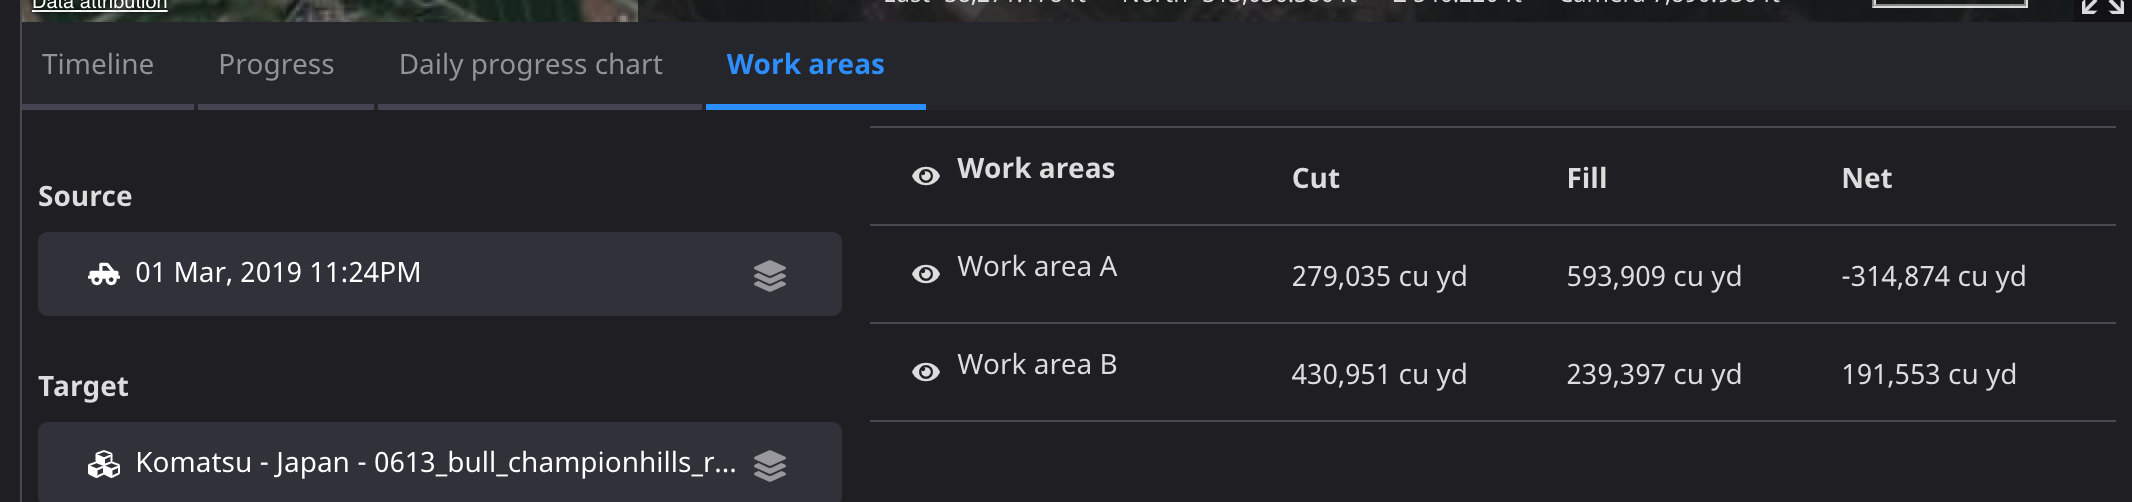
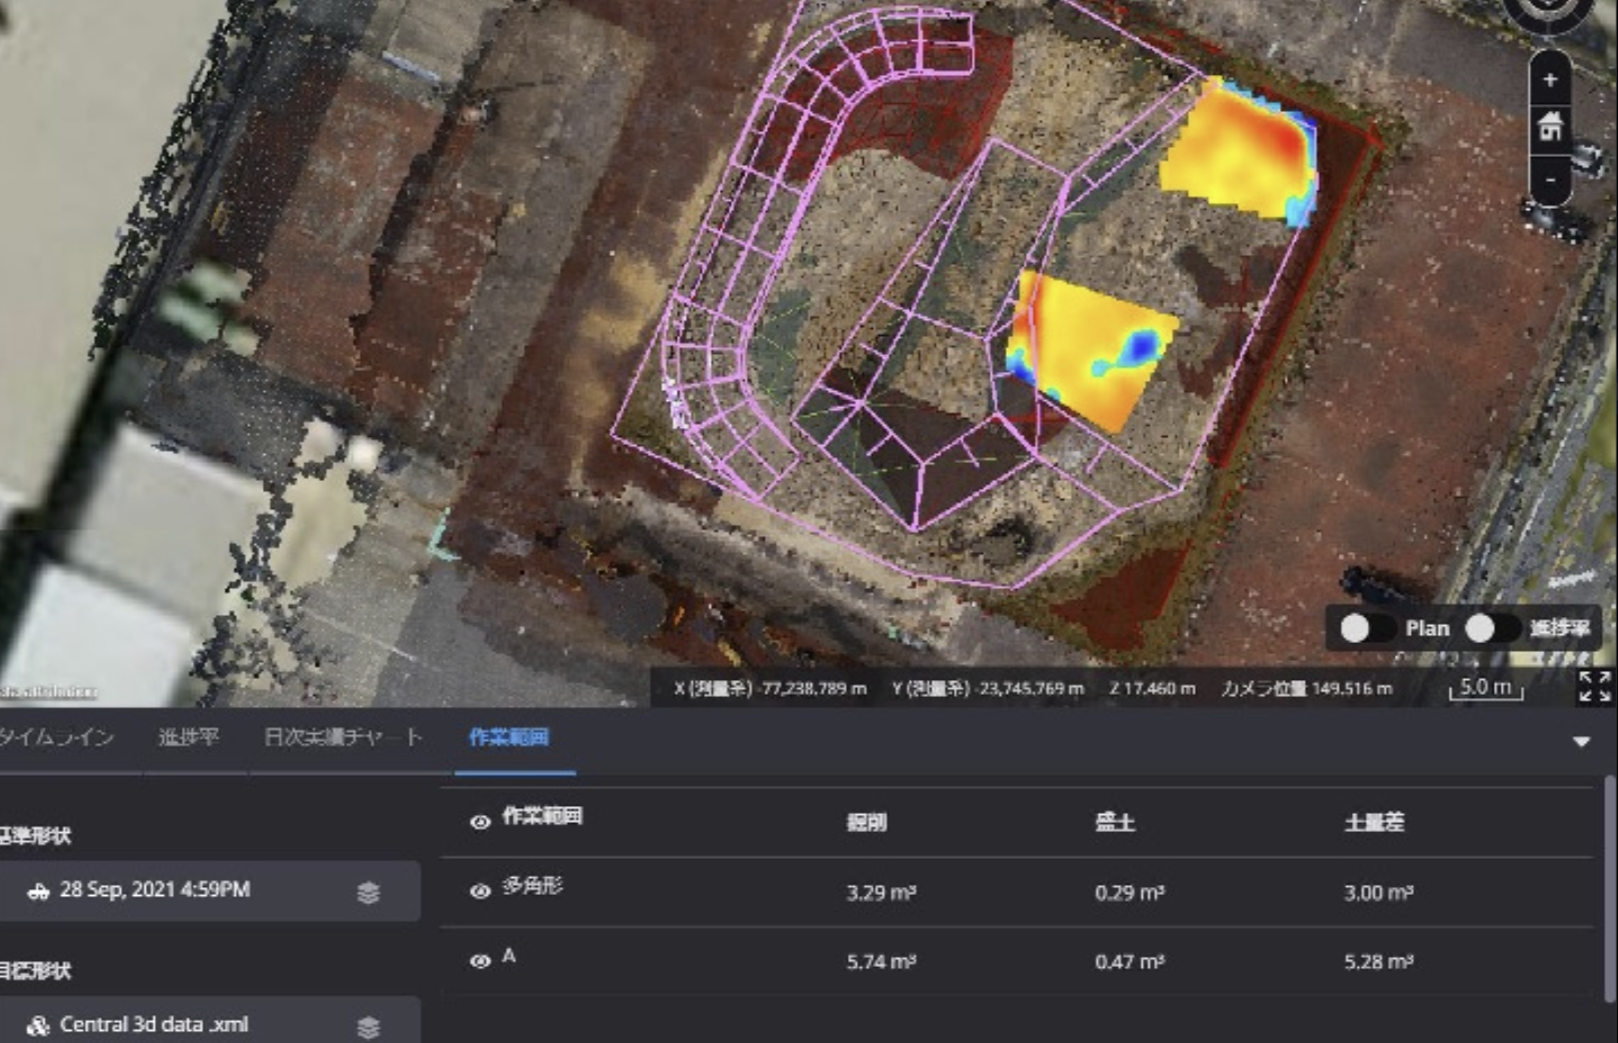
Work areas Use the Work areas tab to compare cut and fill measurements between different areas on the jobsite.
To register a work area, create a polygon annotation, open the context menu, and choose Set as work area. Open the Work areas tab in the bottom panel. The cut and fill results will be displayed. Click the eye icon to toggle heatmaps in the 3D view on or off.
The polygons created by the measurement can be registered as work areas, and the amount of cut and fill for each registered area can be calculated at once.
The terrain to be measured can be selected. The color map is displayed according to the selected terrain.
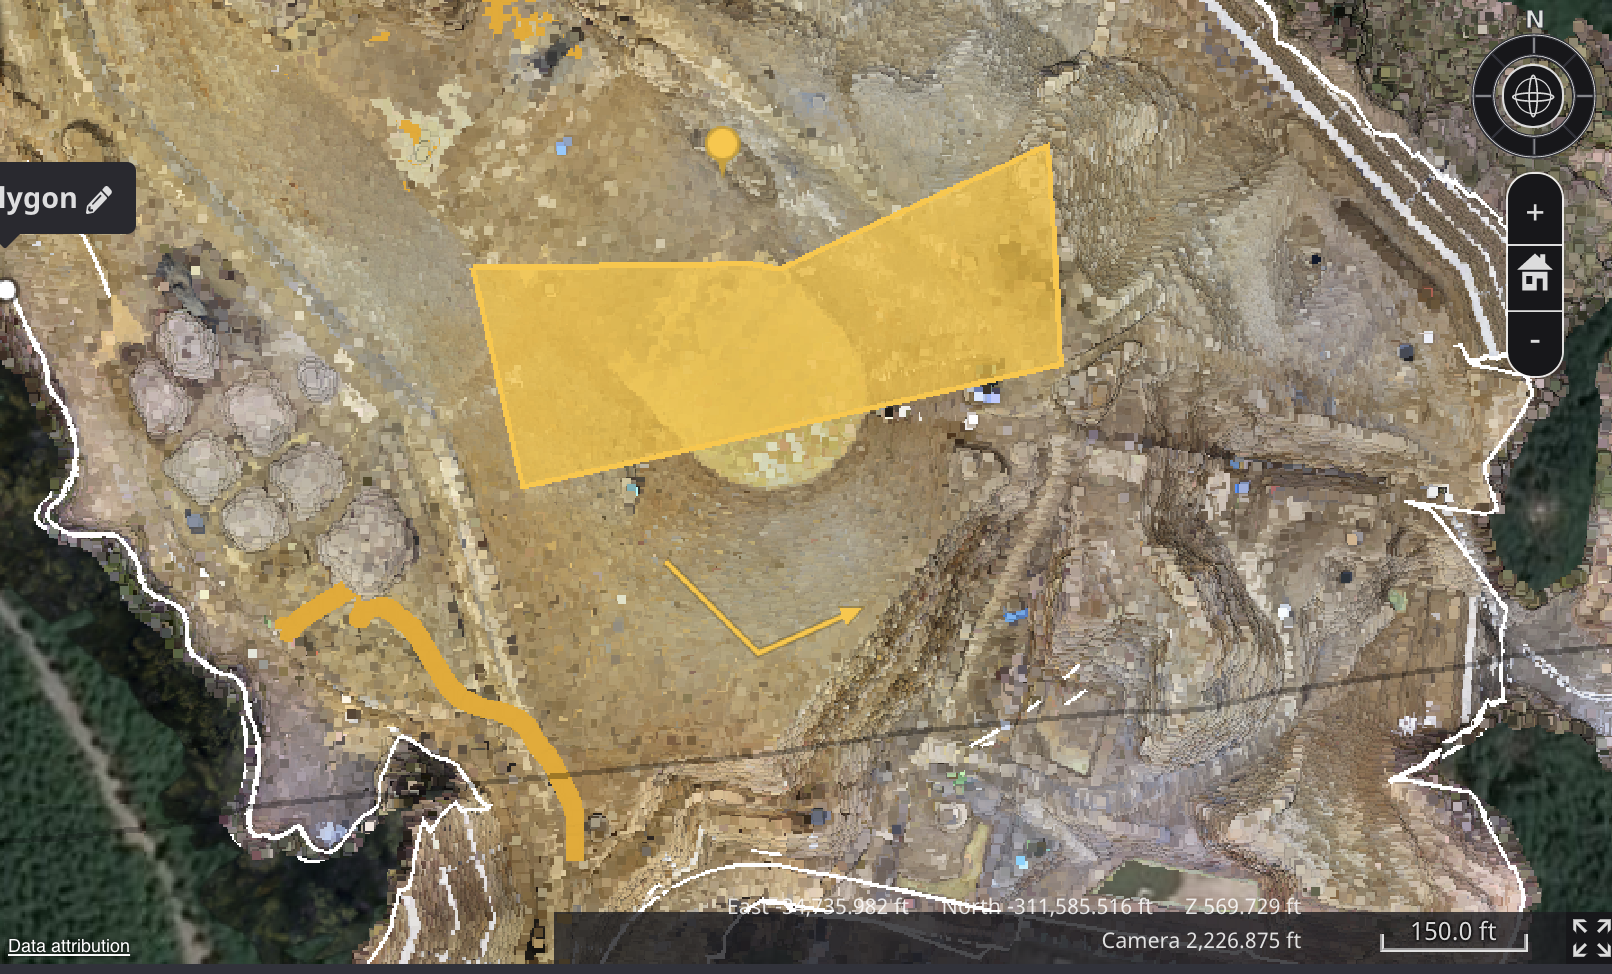
Export screenshots (PNG)
Open a site in the viewer.
Adjust the 3D View window to the view you wish to capture.
In the bottom left of the side panel, click the Download screenshot icon. The image will appear in your downloads.
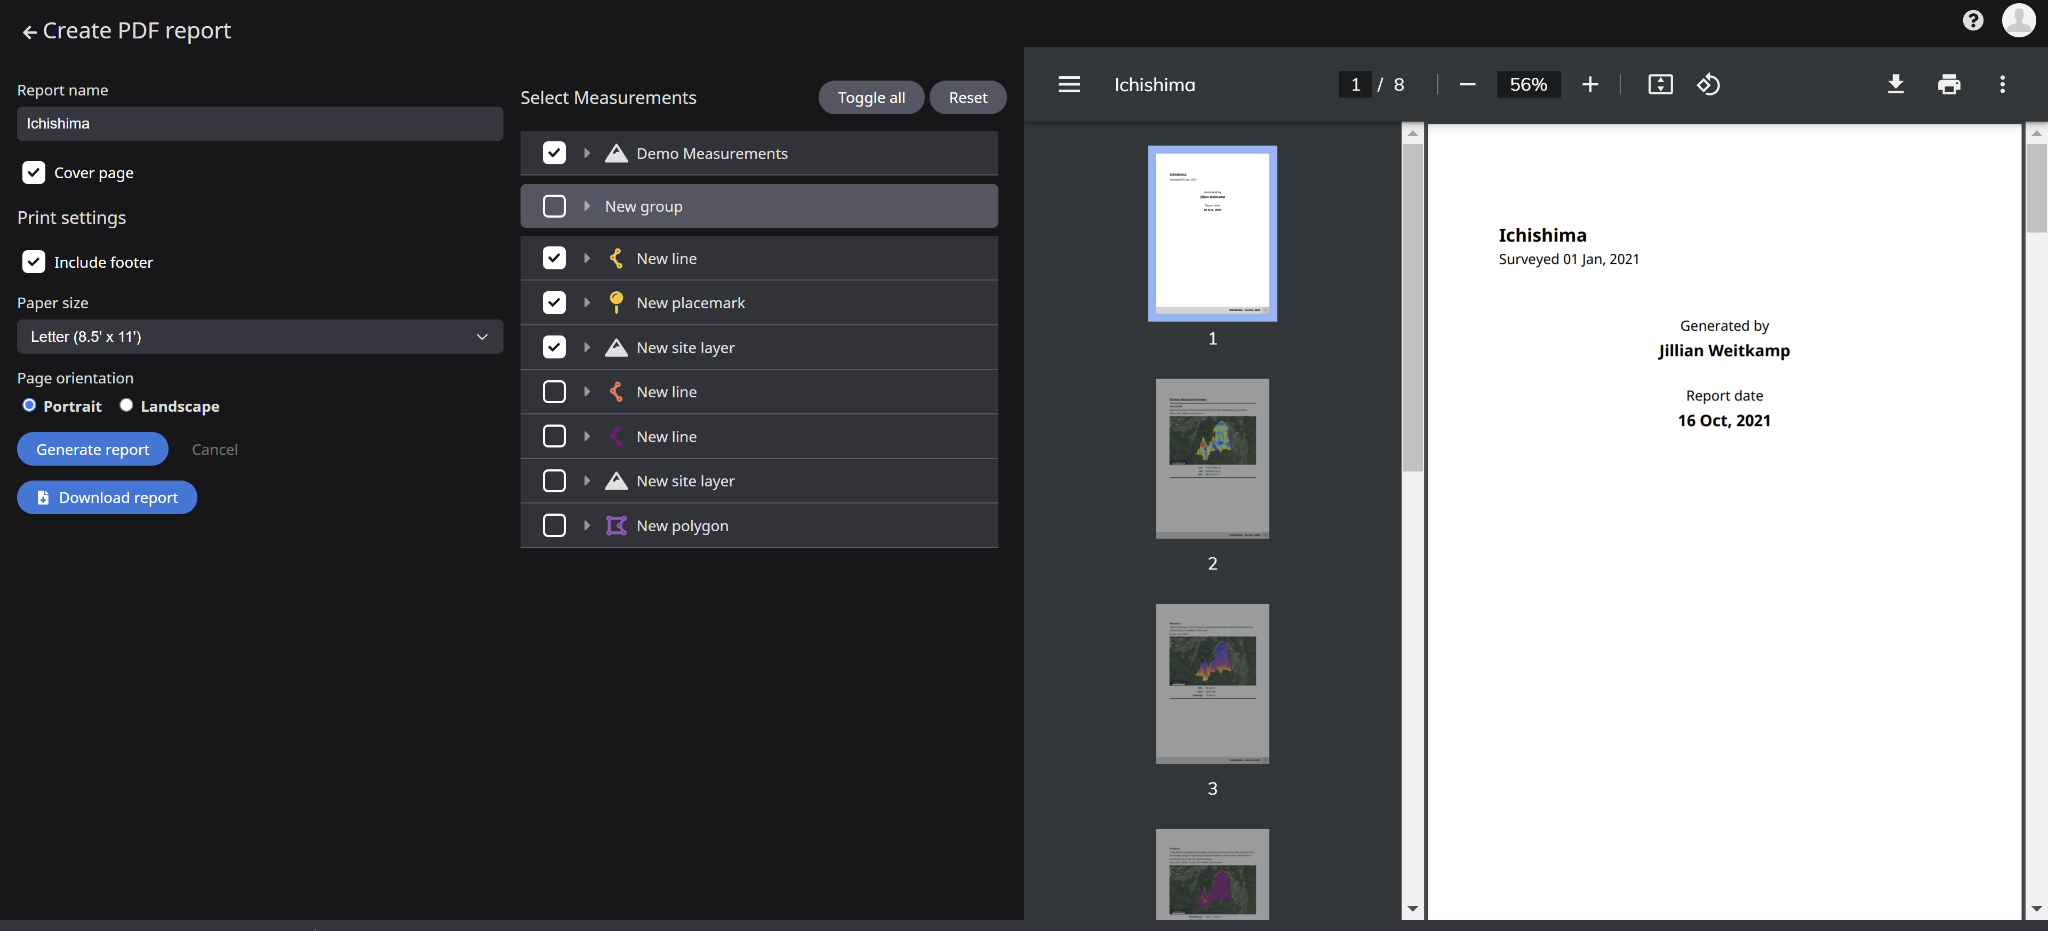
Create a PDF report of your jobsite
Open a site in the viewer. Add any measurements to the site you wish to export.
In the bottom left of the side panel, click the Create PDF report icon. This will open the Create PDF report screen.
Select the measurements that you want included in the PDF report.
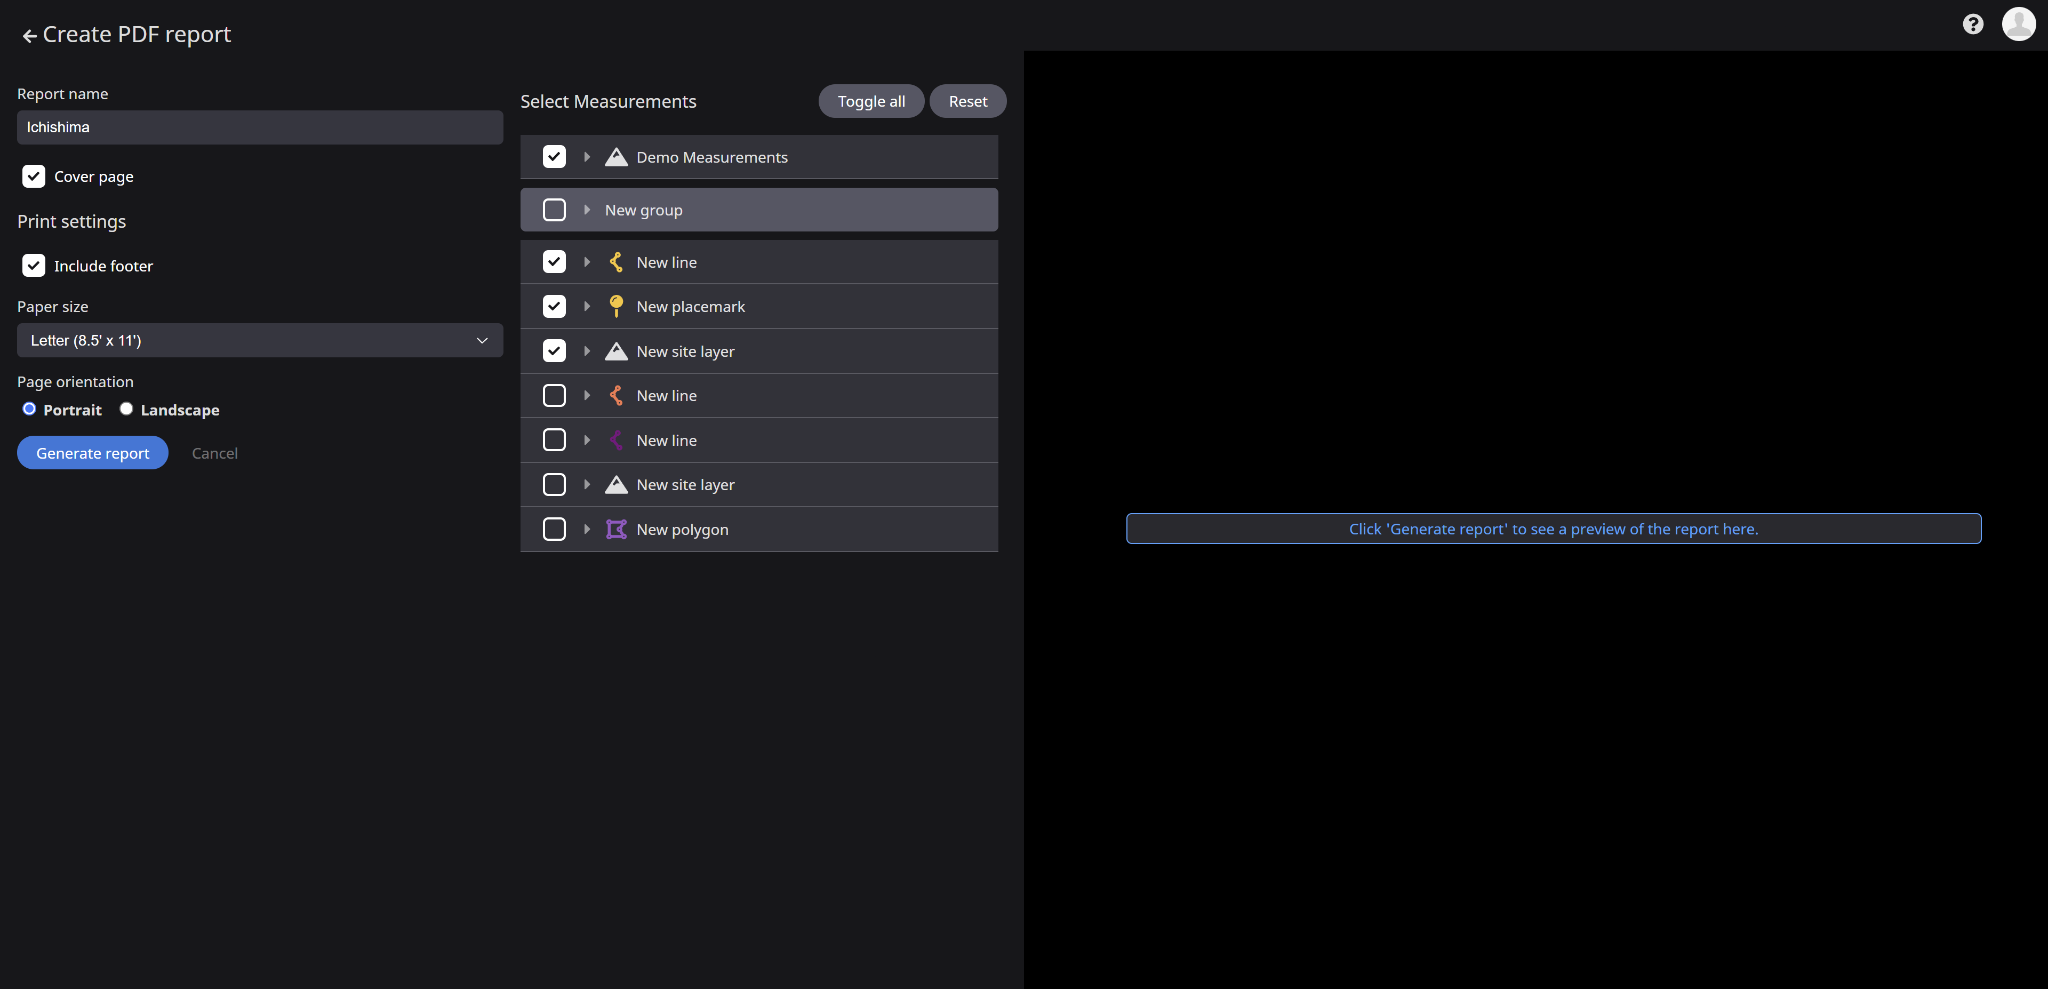
Click the Generate report button. Your report will begin to be generated using the selected measurements. Once the report has completed generating, you will have the option to download the report, or edit the options and generate the report again. Clicking Download report will prompt a screen to appear asking for a Report name and print settings. Adjust as needed, and save. Your report will appear in your downloads bar.


Machine management
Organization machines
To navigate the list of all available machines, click the Machines button on the project list page. This will open the Machines page.
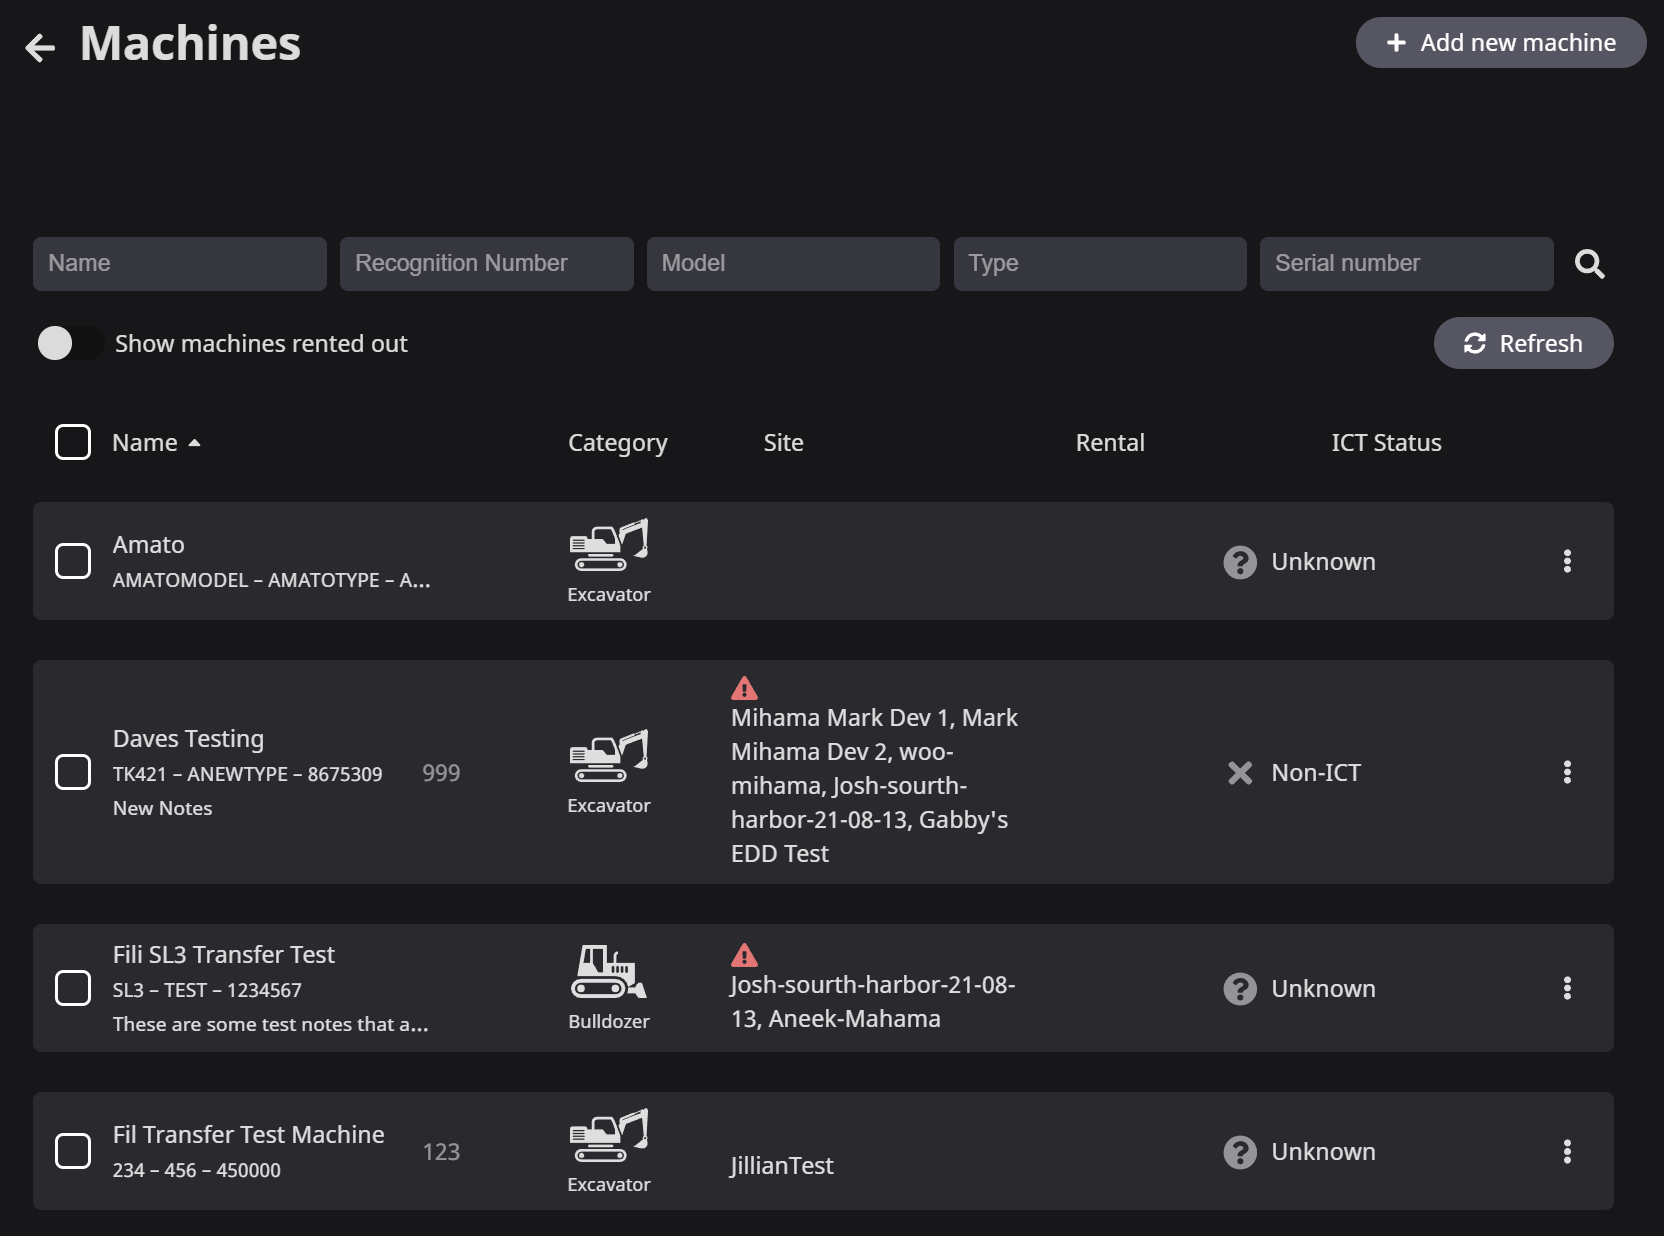
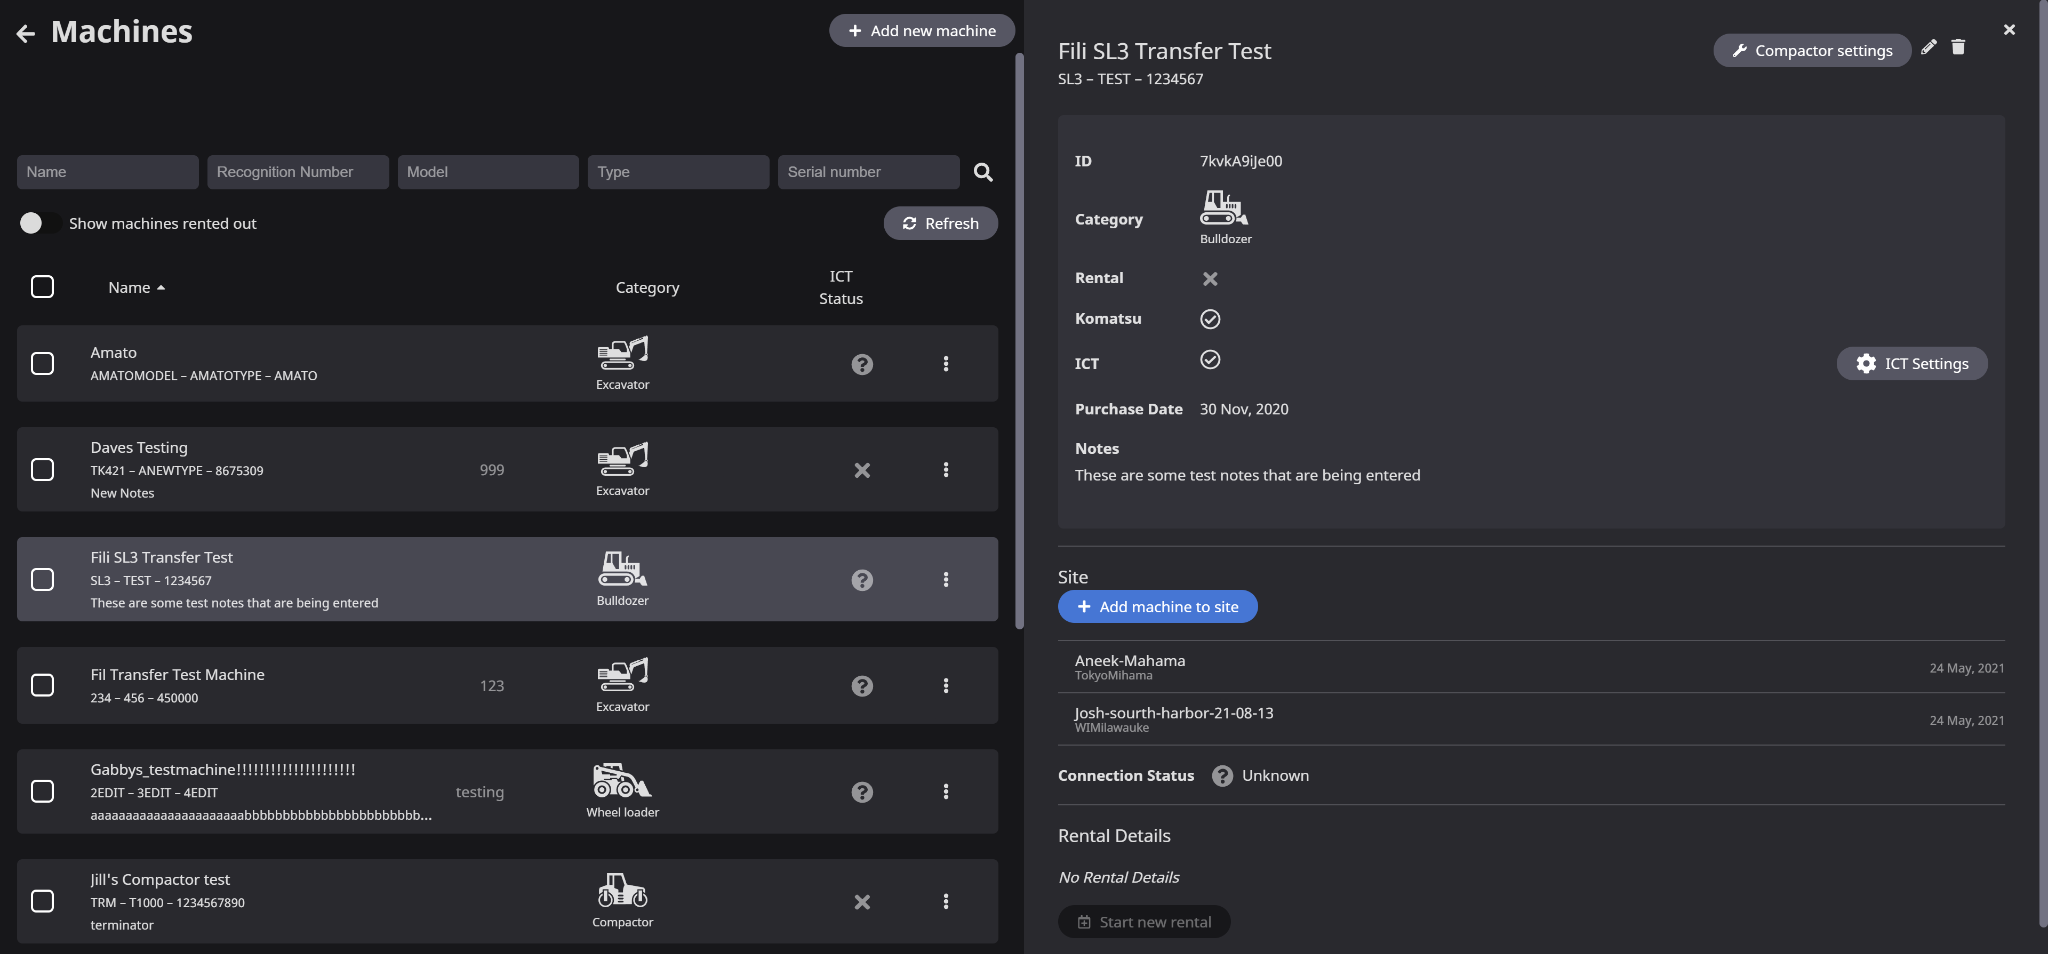
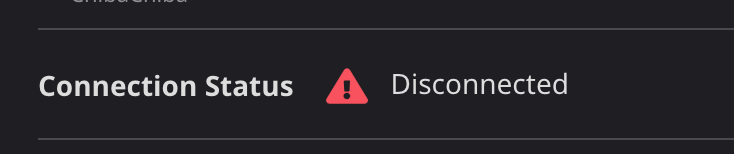
View machine details To examine the details of a machine, click an item in the list. This will open the machine detail panel. Here you can view basic machine identification information, connection status, assigned job sites, and rental information.
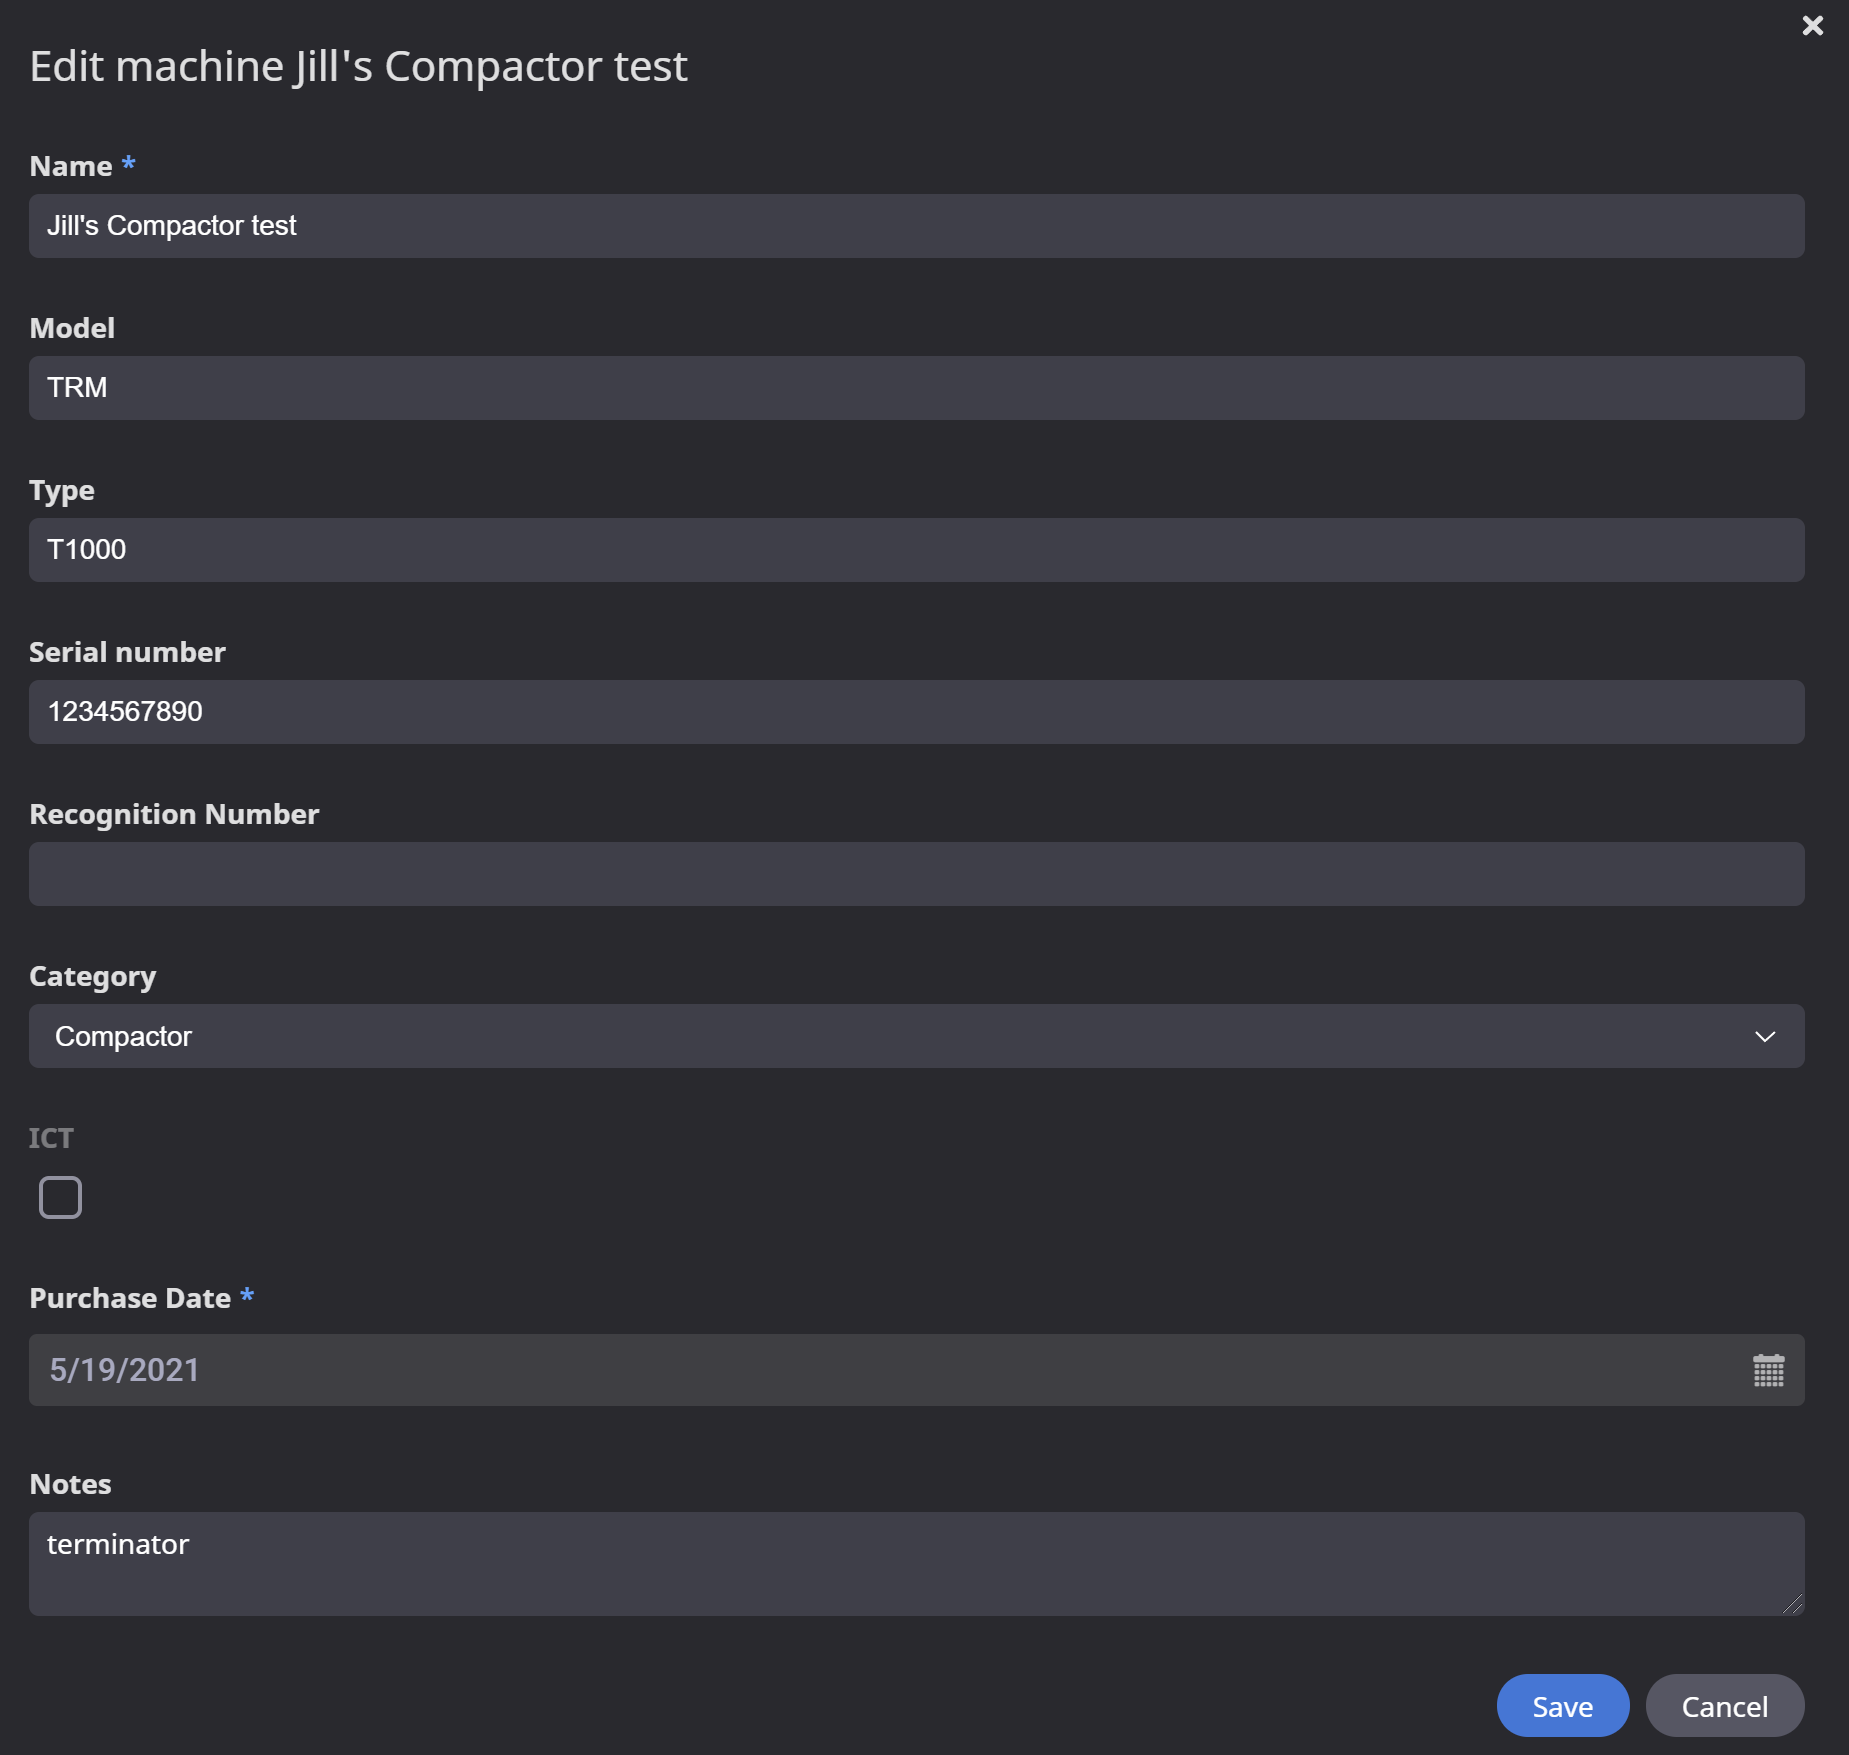
Add a machine To register a new machine, click Add new machine. Enter the machine details including Name, Model, Type, Serial number, and category. Click Add to add the machine.
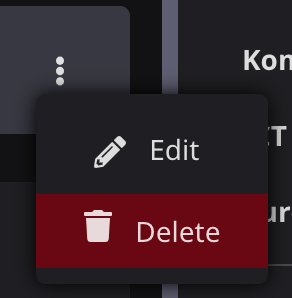
Edit machine details To edit basic machine details, open the machine detail panel, and click the pencil icon. Confirm the machine options and click
Delete a machine To delete a machine entirely, click the delete button and confirm.
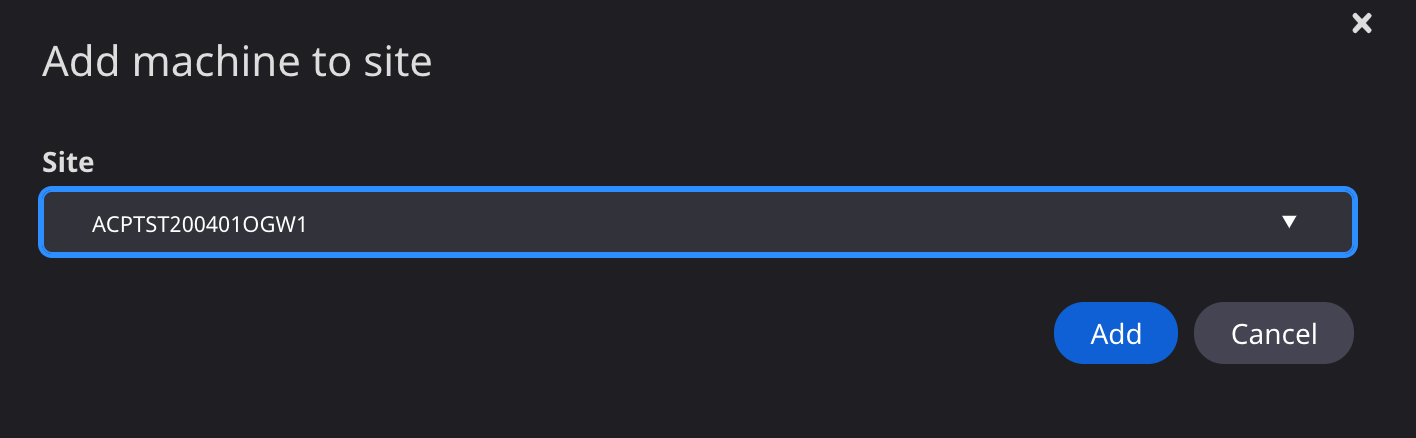
Register machine to a site To register a machine to a jobsite, click Add machine to site. On the next screen, select a jobsite from the list, and click Add. The site will now be displayed on the machine details page.
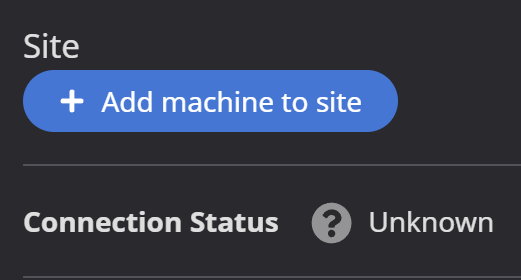
ICT connections The ICT status (Non-ICT, connect, disconnected) is displayed under the machine site details.
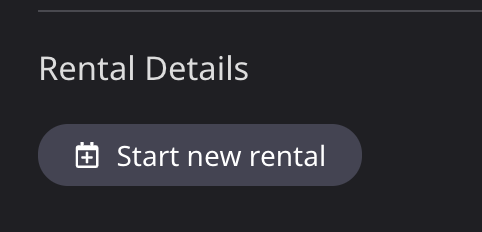
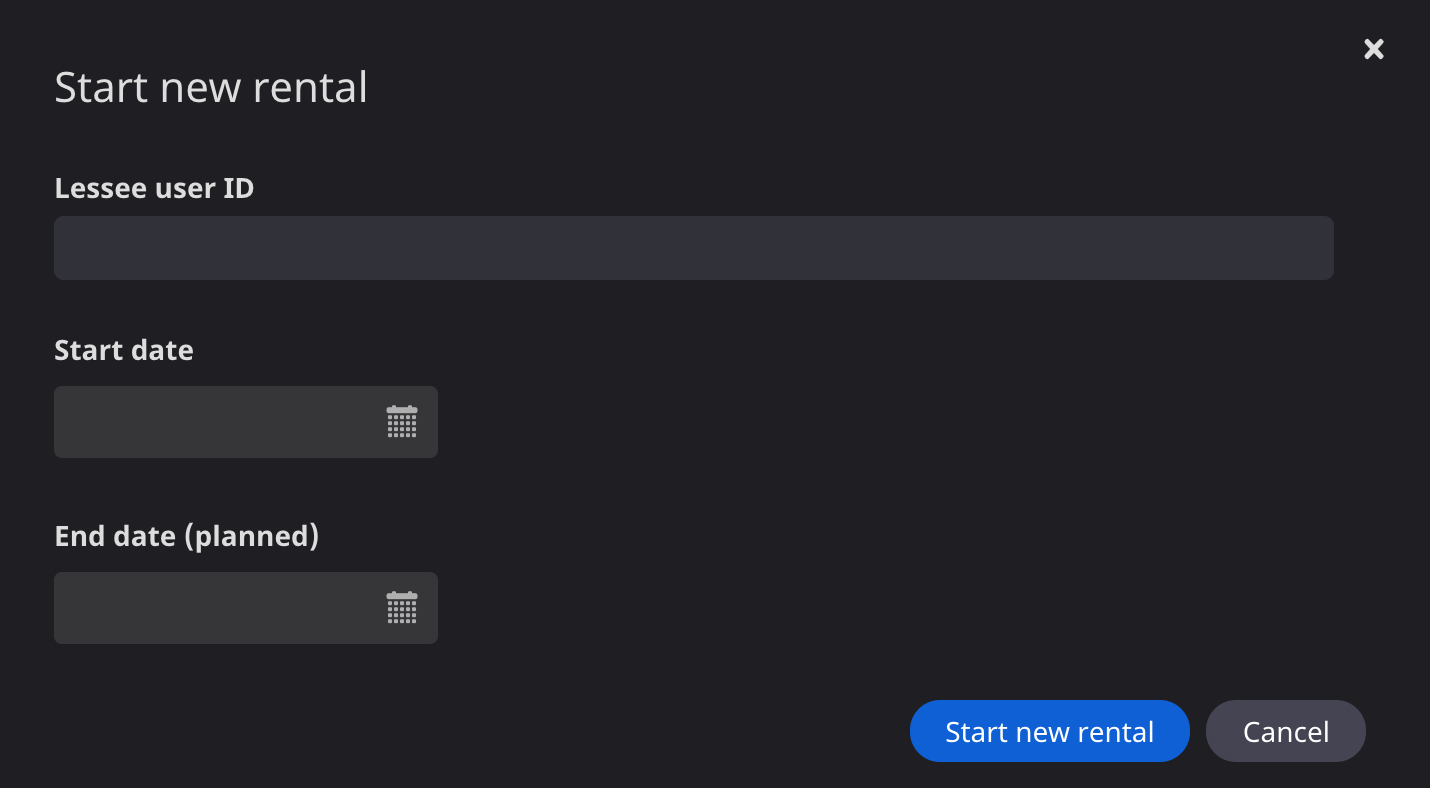
Machine Rentals If a machine is owned, not rented to another organization, and not assigned to a site, the machine can be rented. Click the Start new rental button under Rental Details to start a rental. Enter the rental details, including the user ID (email) of the user who the machine will be rented to. The start date must be after the machine purchase date, and the end date (planned) must be after the start date. Click Start new rental.
Jobsite machines
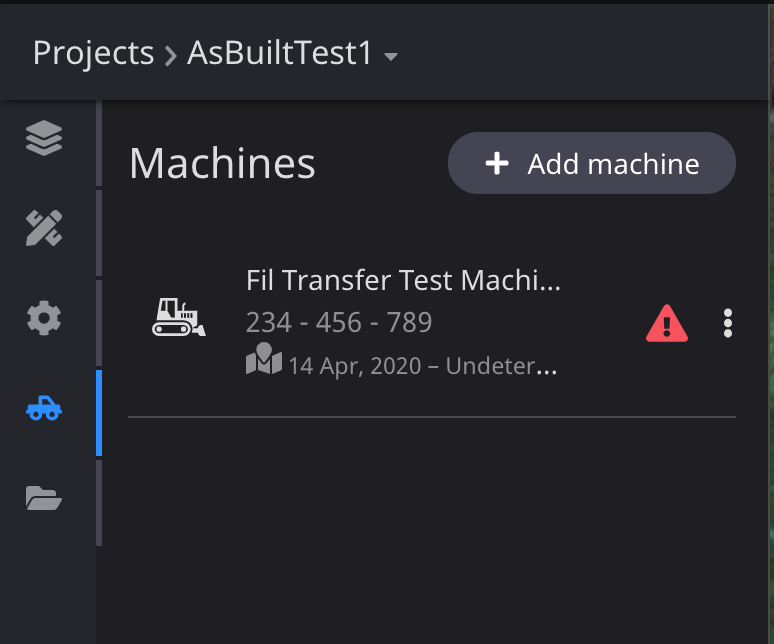
Once a machine has been added to a jobsite, open the jobsite in the viewer and open the Machines tab in the side panel to get an understanding of the activity of these machines.
View list of machines on site Opening the Machines tab in the side panel will display a list of machines assigned to the site.
Click on a machine to view machine details.
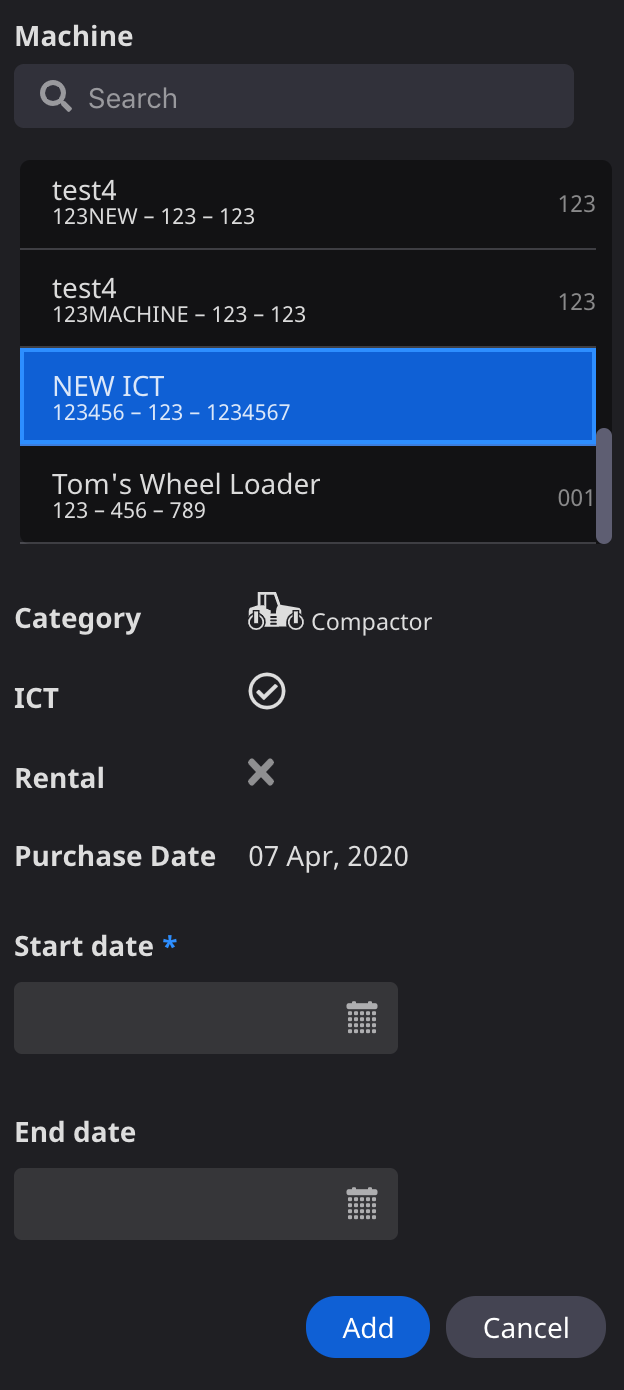
Add machine to site Click Add Machine to add an existing machine to the site. Search the list of available machines. Select a machine to view additional details. Enter the start date of operation and optionally the end date of operation. Confirm the details and click Add.

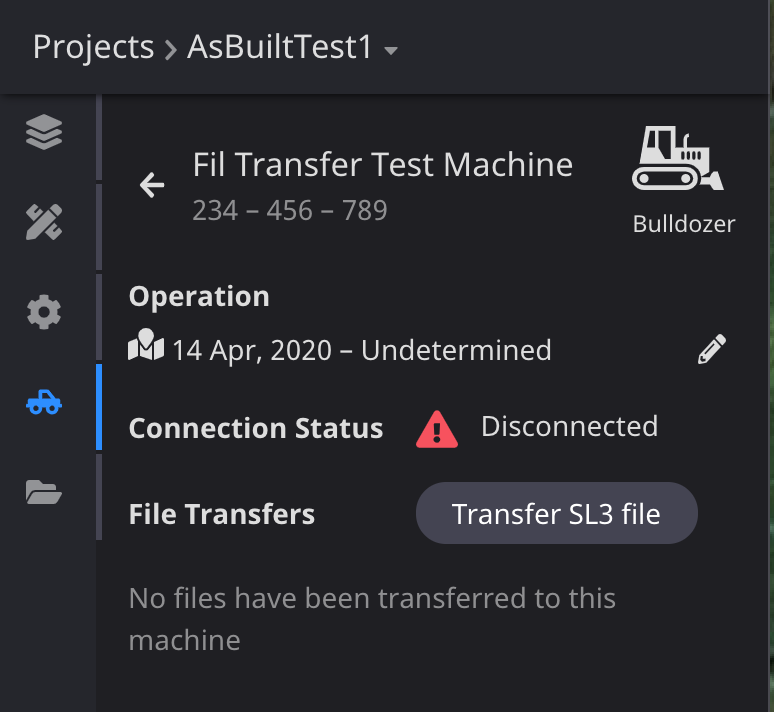
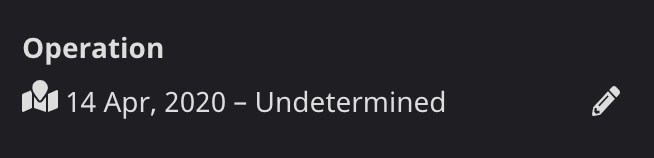
Operation period The operation period describes the dates the machine is working on the site. The end date will be Undetermined until set.
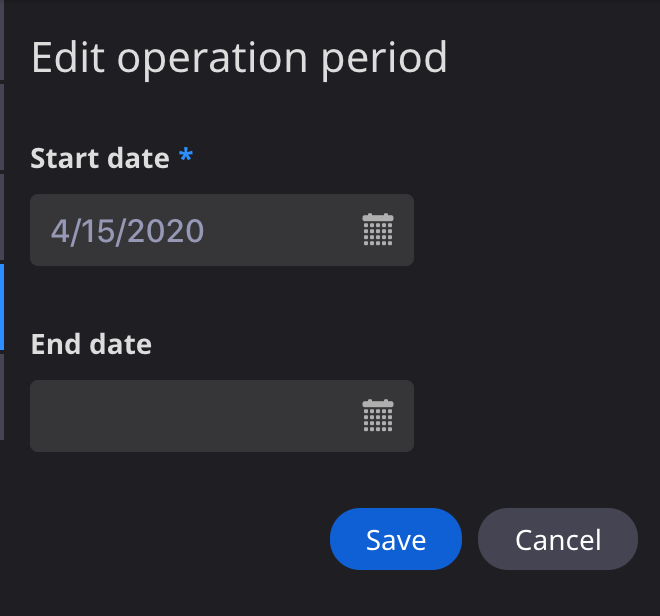
To edit the dates of operation, click the pencil icon. Confirm the start date and optionally the end date, then click Save.
Machine file transfers
View the list of machine transfers To view the list of files transferred to a machine, open the Machines panel in the sidebar, then select a machine.
Request to transfer site SL3 file The site’s SL3 file must be transferred to a machine along with any design files. To transfer the SL3 file, open the machine in the sidebar and click Transfer SL3 file.

Select one or more machines to transfer the file to and click Next. Select a user to confirm the transfer and click Request transfer.
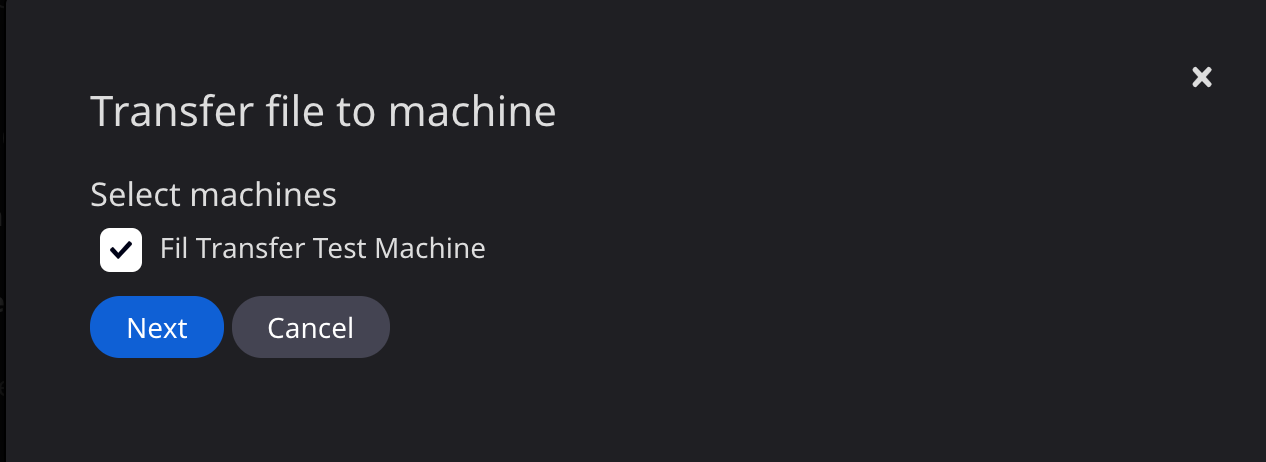

Transfer design file To transfer a design file to a machine, open the Data Layers panel in the sidebar. Select a TP3 design layer that has been added to the project, open the context menu, and click Transfer to machine. Select one or more machines to transfer the file to and click Next. Select a user to confirm the transfer and click Request transfer.
Transfer other file types
User can also send other file for machine to send machine via Project file manu.
See for details.
Machine remote support
Dashboard has a remote support function that allows users to view the controller screen and remotely operate the controller on the construction equipment tied to the job site. The remote support function can be accessed from the list of construction equipment in the organization or the list of construction equipment in the project.
This function is not available in North America.
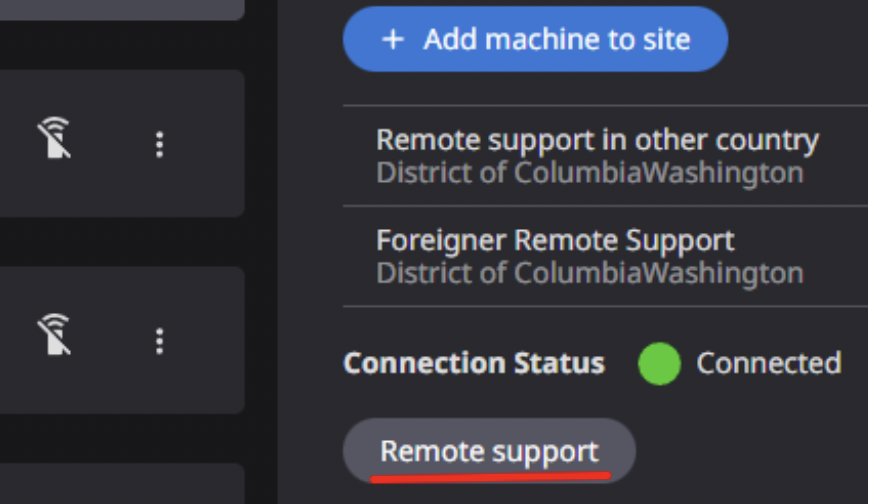
Remote support from Organization Machine list
This is the remote support function from the organization's list of construction machines.
The Remote Support button is only enabled when the construction machine is online.
When the Remote Support button is pressed, a new browser tab will open and the same screen as the controller of the construction machine will be displayed. Whether the screen is displayed only or can be operated depends on the user's authority and the region of use. (For details, please refer to .)
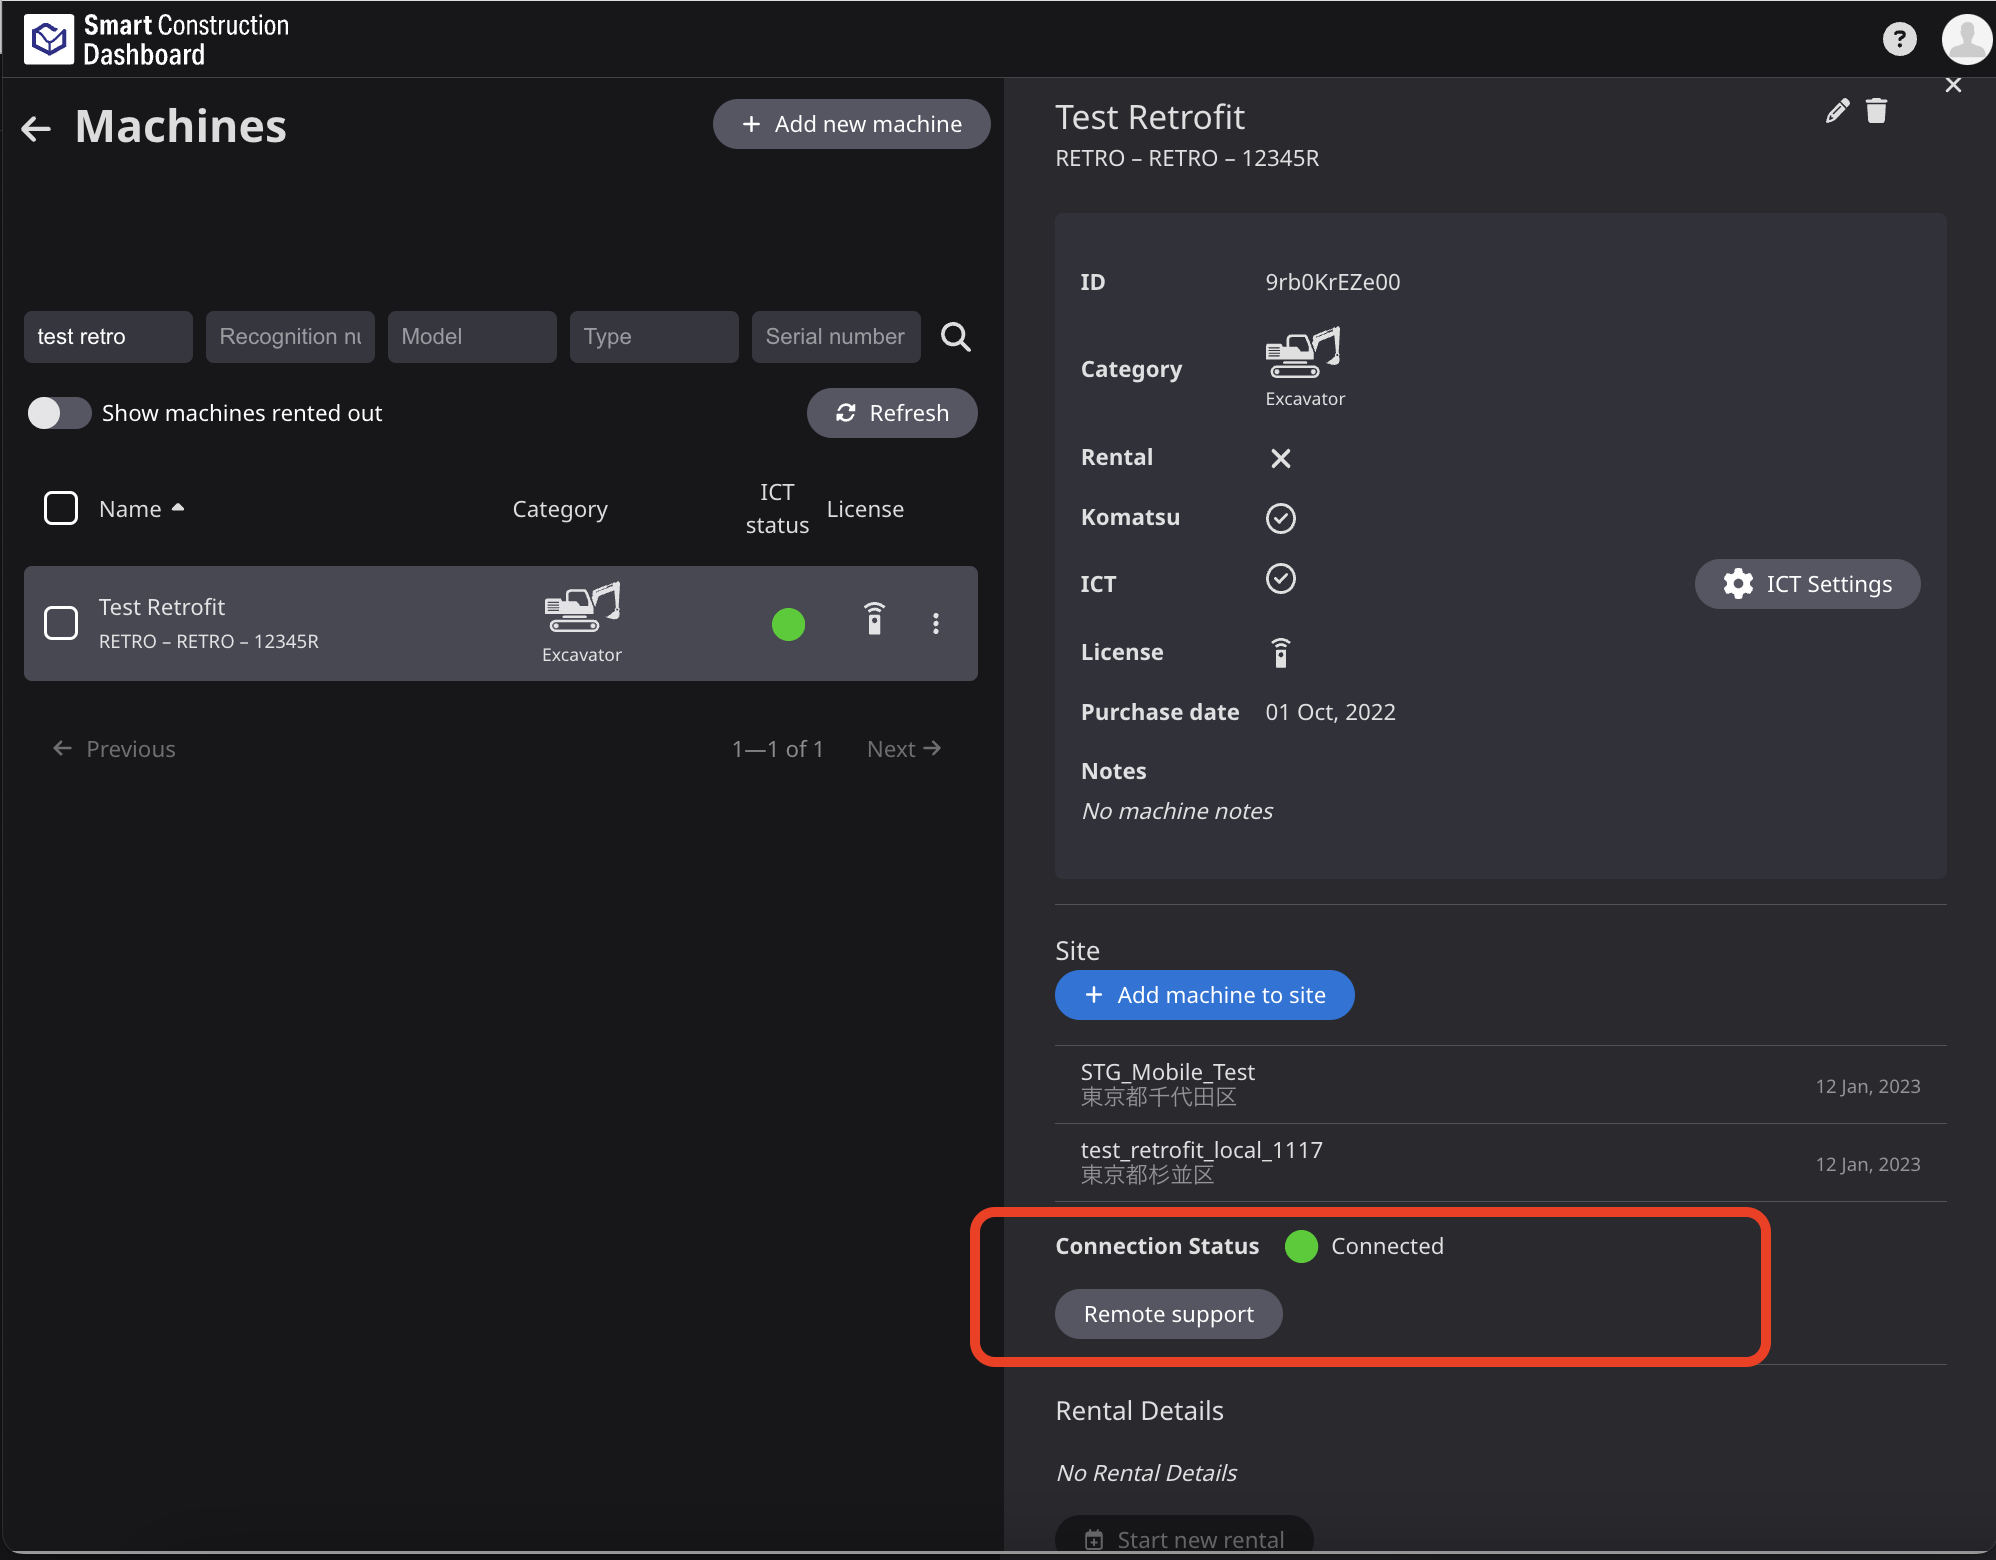
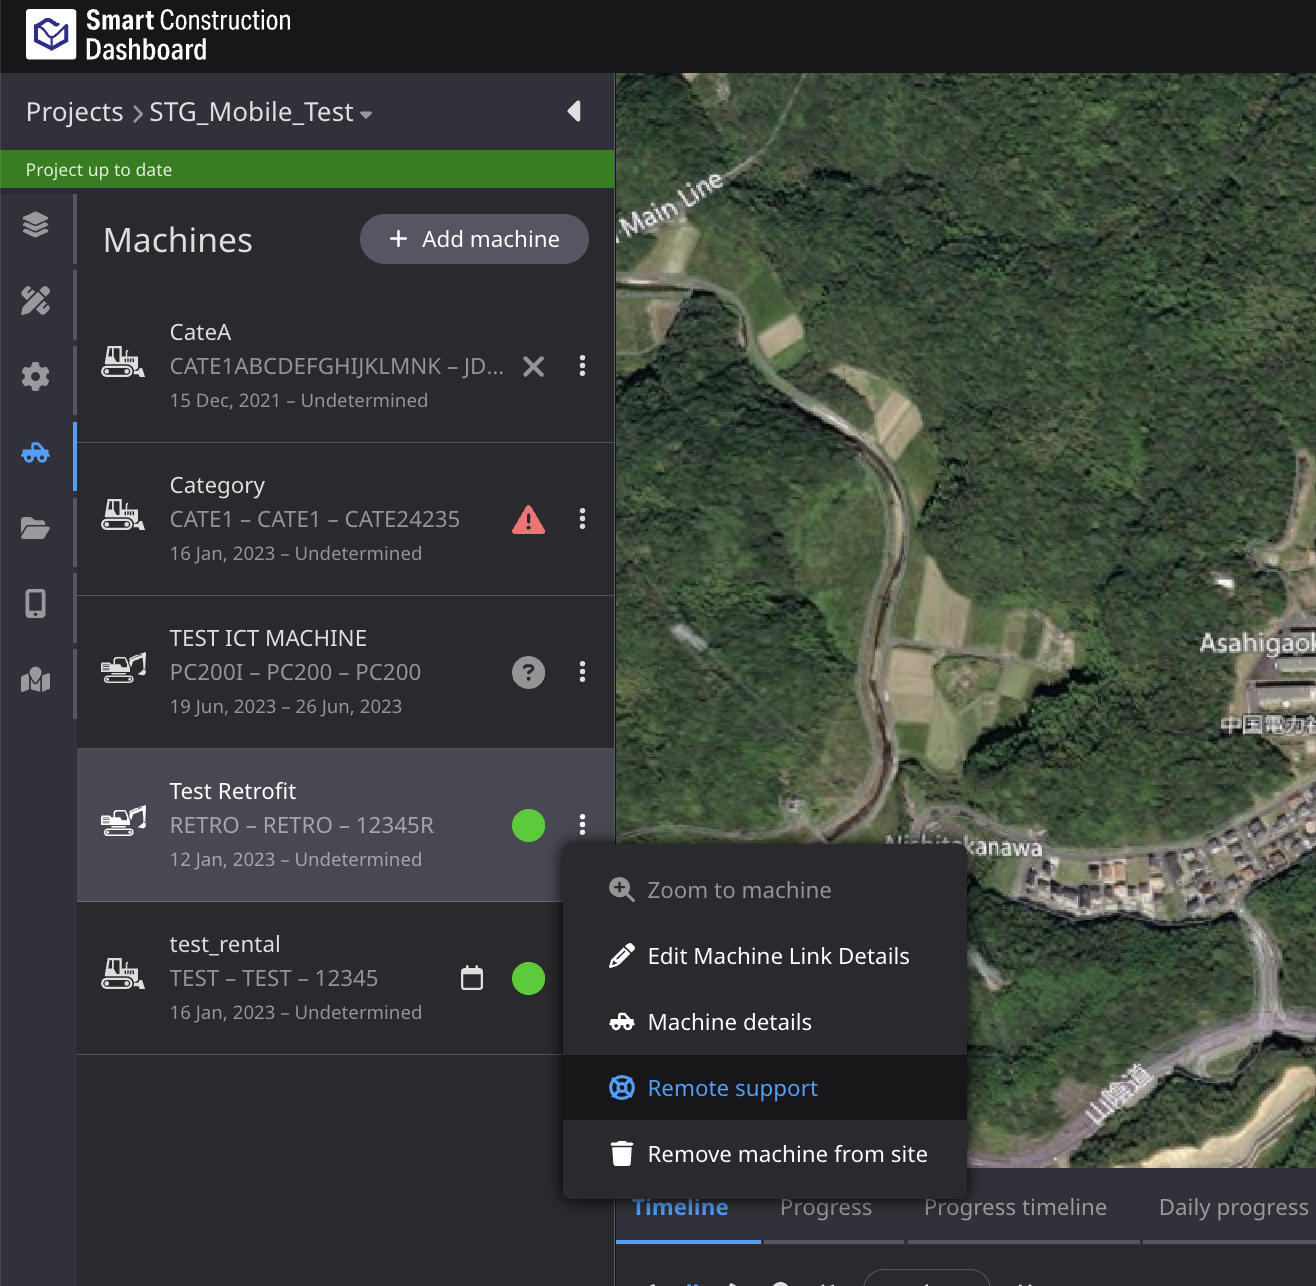
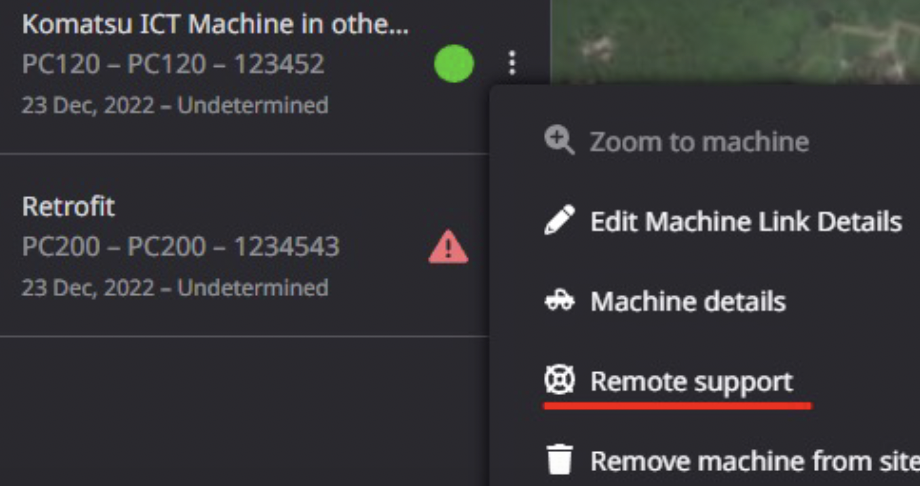
Remote support from Project Machine list
This is the remote support function from Project Machine list.
Remote support button is available only when the machine is online.
When the Remote Support button is pressed, a new browser tab will open and the same screen as the controller of the construction machine will be displayed. Whether the screen is displayed only or can be operated depends on the user's authority and the region of use. (For details, please refer to .)
User Permission of Remote Support
Remote support from Organization Machine List
- Use Group Role only
| Role | Japan | Outside Japan except North America | North America |
| SuperAdmin | Remote View Only | Remote Control | Not Allowed |
| Admin | Remote View Only | Remote Control | Not Allowed |
| Manager | Not Allowed | Not Allowed | Not Allowed |
| Staff | Not Allowed | Not Allowed | Not Allowed |
Remote Support from Project machine list
* Use Project Role only
| Role | Japan | Outside Japan except North America | North America |
| Manage | Remote View Only | Remote Control | Not Allowed |
| Measure | Remote View Only | Remote Control | Not Allowed |
| View | Not Allowed | Not Allowed | Not Allowed |
| None | Not Allowed | Not Allowed | Not Allowed |
Communications with Dashoard Mobile app
About Dashboard Mobile
The Dashboard Mobile App is an application that allows field workers in the field to check the latest terrain conditions, implement work based on instructions from the Dashboard, and report on the work using messages, photos, etc., utilizing the field created on the Dashboard.
The Mobile App has the following functions:
1. display of the terrain
2. communication among field workers and managers
3. photo sharing
4. navigation to the indicated points
Dashboard has the features to send work orders to the DashboardMobile app and view messages and photos reported from it.
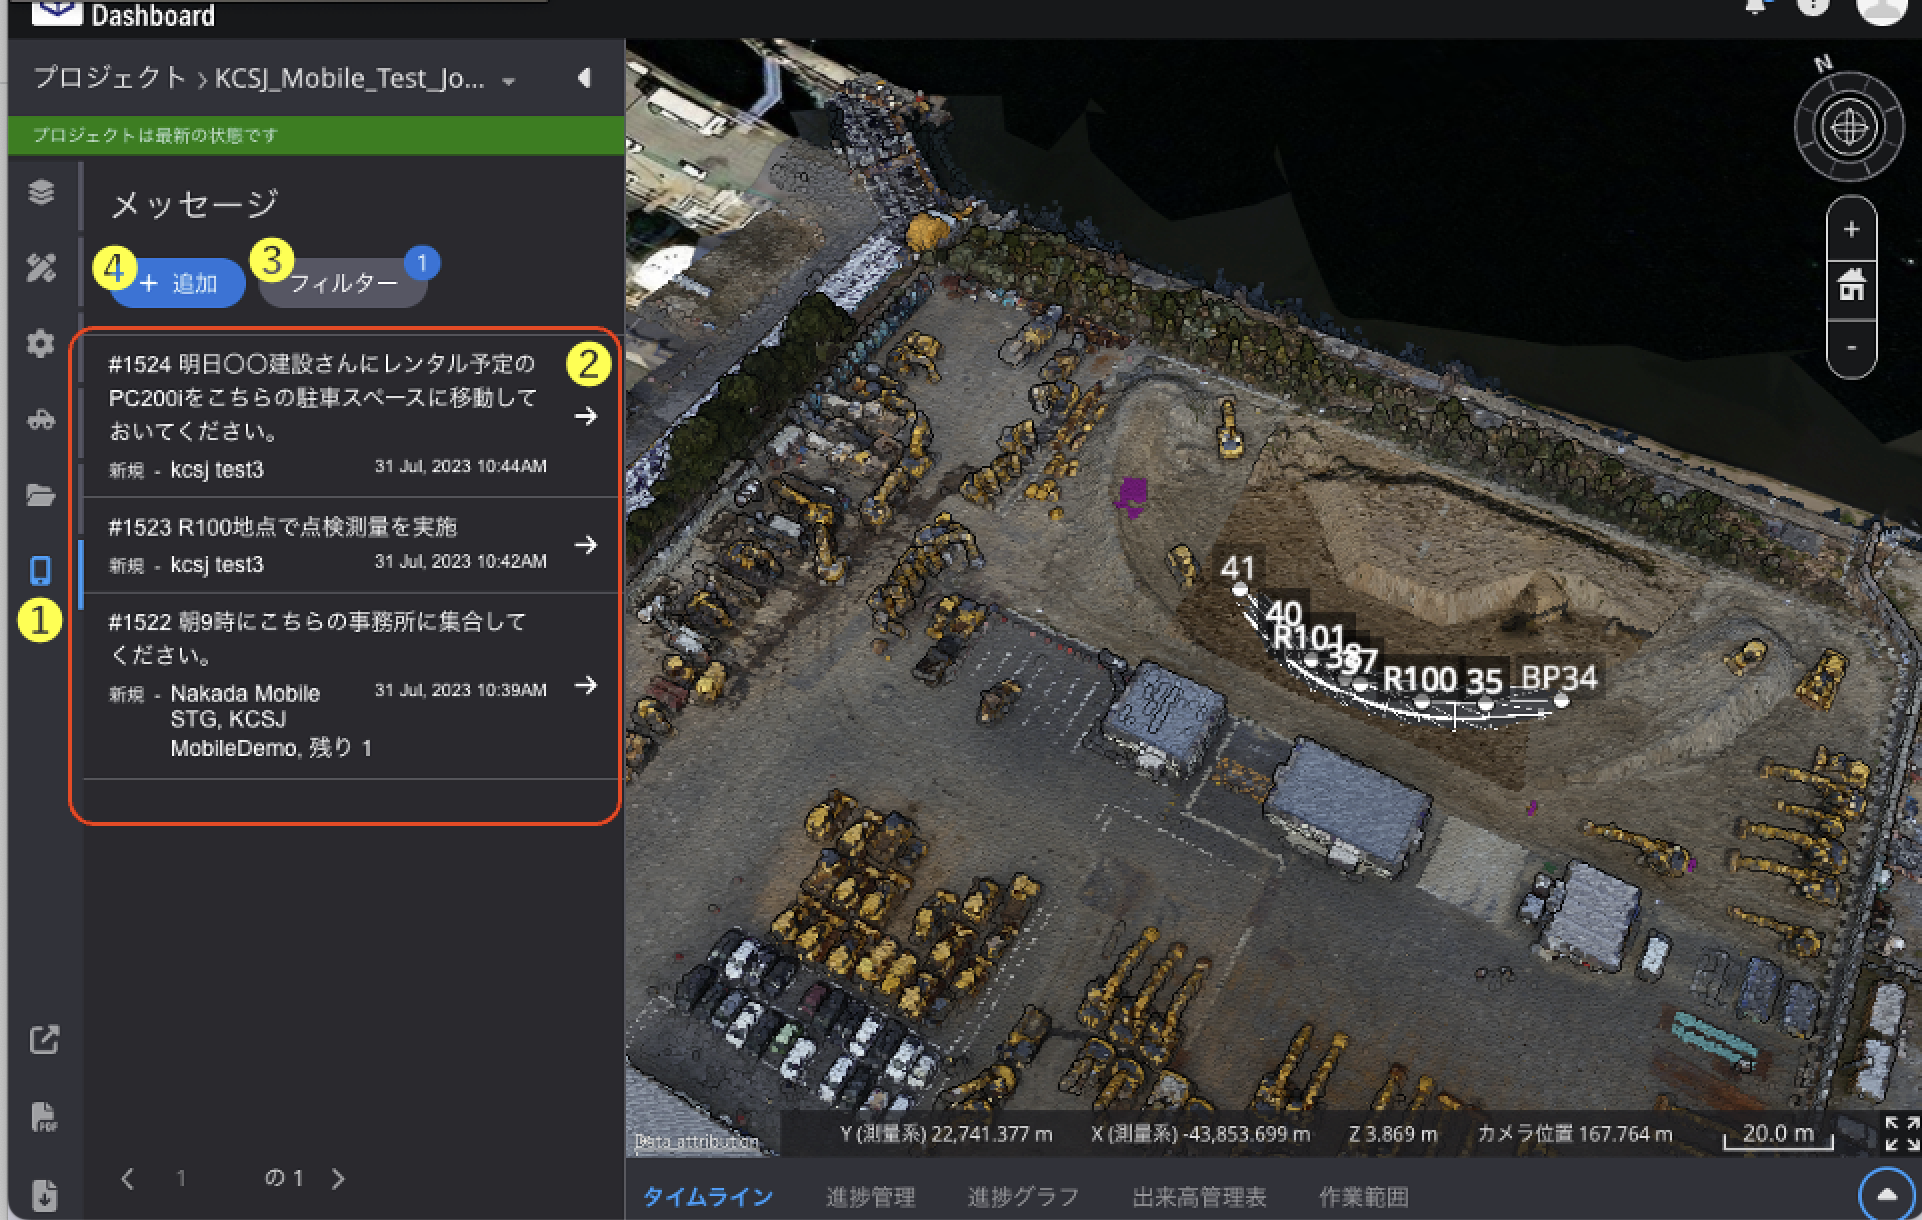
Communication function on Dashboard
- communication tab: used for integration with the mobile version
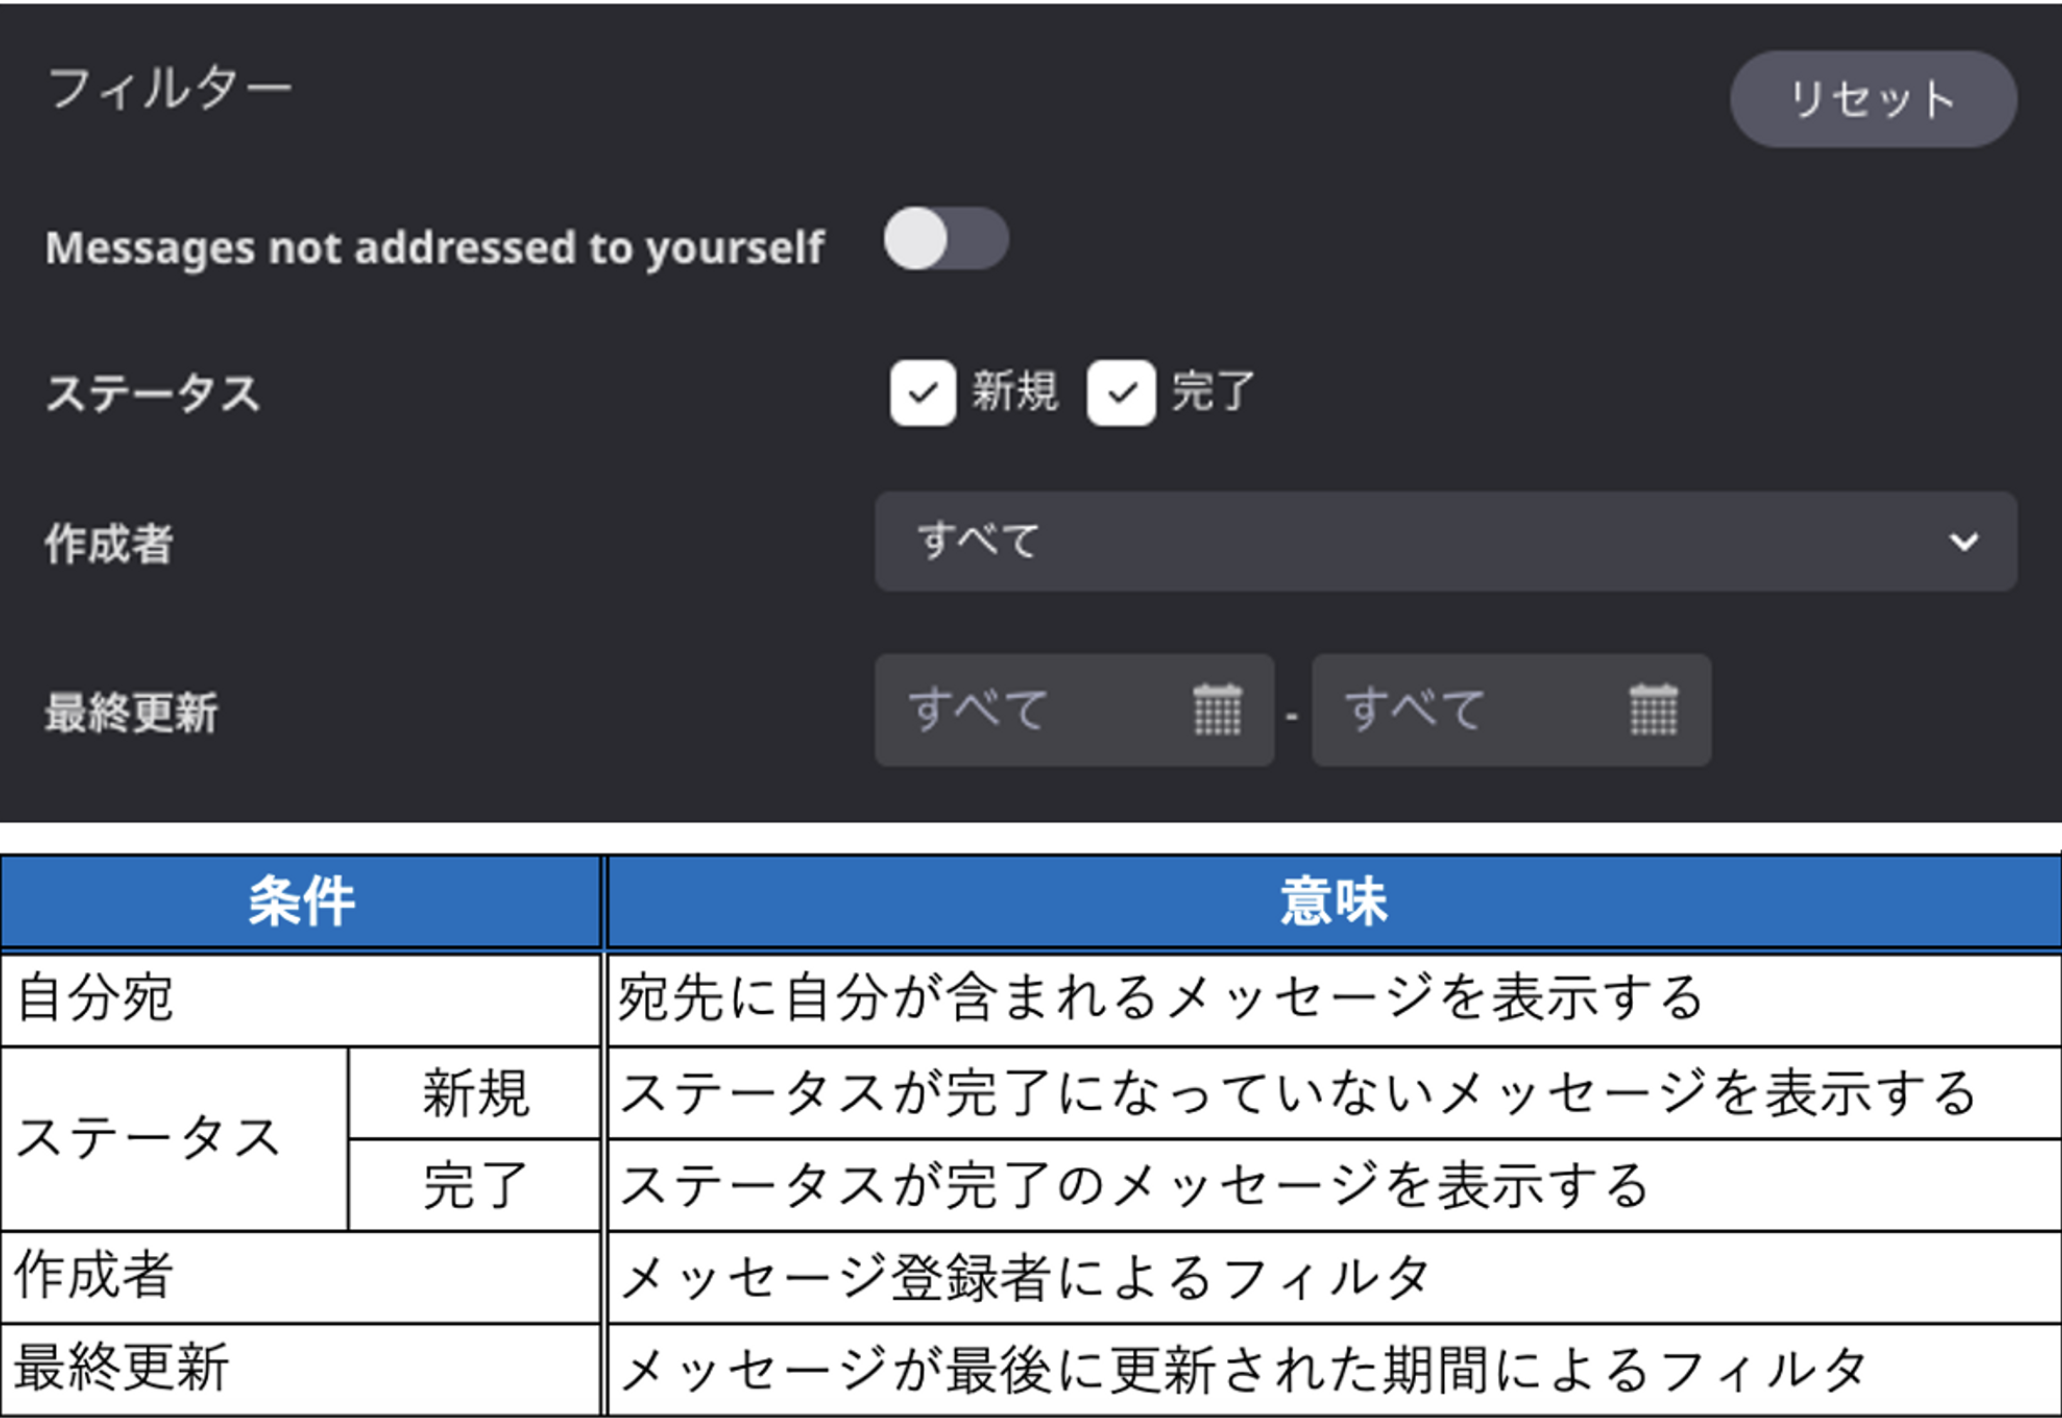
- Message List: Displays a list of messages filtered by the 3 filters. 3
- .Filter button: Used to filter the list to display only the messages you need.
- Add button: Used to add a new message. See for details.
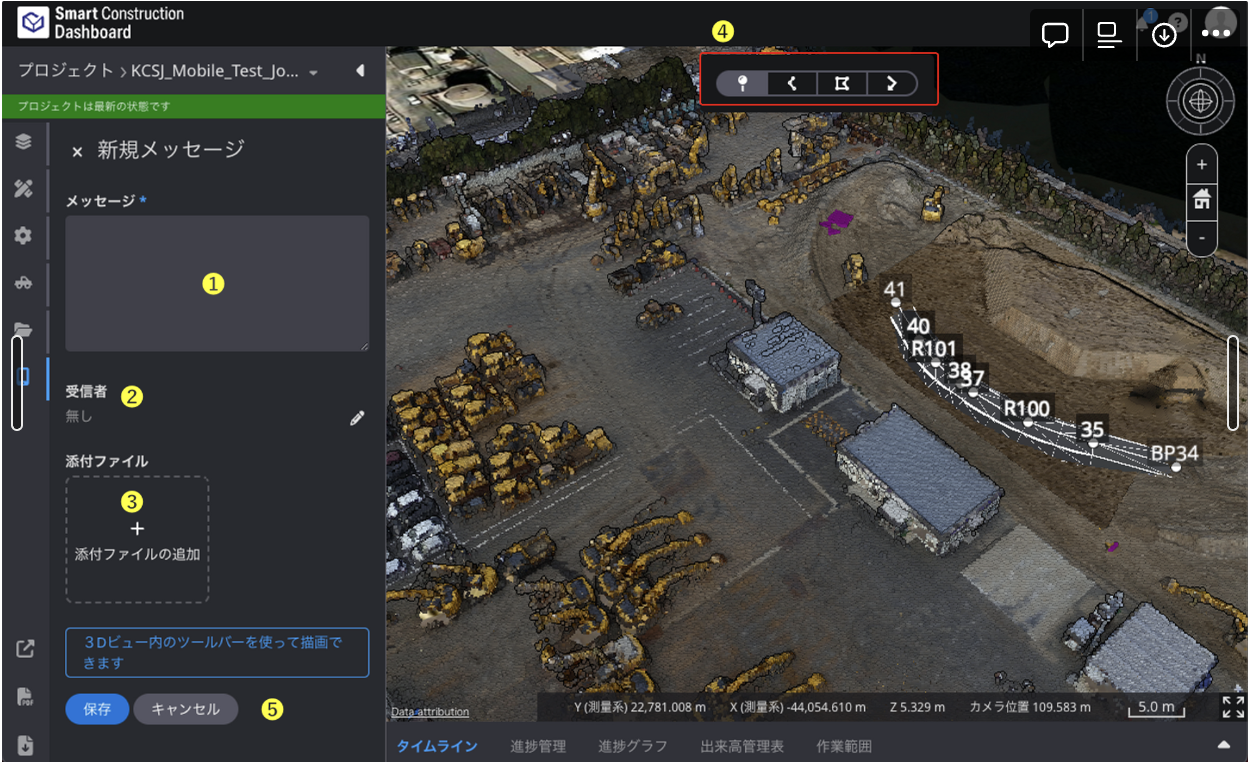
Create New Message
- message (required): Describe your message (work instructions, etc.)
- recipient (optional): Specify the recipient of the message
- Attachment (optional): Attach image files such as drawings or photos.
- Drawing palette (optional): [points, lines, planes, arrows] can be used to indicate specific locations Multiple drawings can be entered in one message. You cannot modify (re-edit) a drawing, so click on an unwanted drawing, select "Delete," and then draw a new annotation again.
- Save/Cancel: Click "Save" or "Cancel" to save or cancel the message. If Cancel is clicked, the previous description will be canceled.
Measurement Order to Smart Construction Rover
Create Measurement order
Show Measurement result